Step-by-step Pricing Strategy Diagram
RM0100001_28
- Last Update 01/24/2025
- File Size 2MB
- # of Slides 2
- File Format PPTX
- Slide Ratio 16:9
- Color
Keywords
- #Content-Based Slides
- #Design-Based Slides
- #Business Strategy
- #Marketing Plan and Strategy
- #Diagram
- #Step-by-Step Schedule Plan
- #Pricing Strategy
- #Flow
- #Table
- #Linear Flow
- #16:9
- #circular diagram PowerPoint
- #5-step process diagram
- #pricing strategy slide
- #business process flow diagram
- #marketing strategy PowerPoint slide template
About the Product
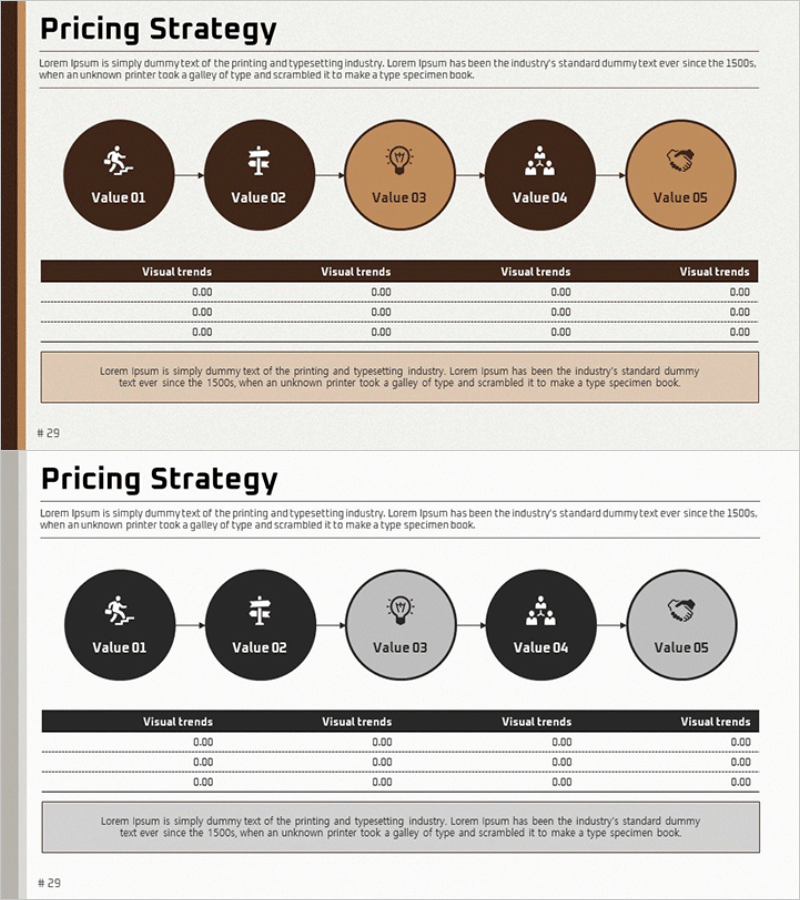
A circular pricing strategy diagram PowerPoint slide featuring five connected nodes representing sequential value stages. The design uses a warm brown and beige color palette suitable for professional business presentations. Each stage (Value 01 through Value 05) is marked with distinct icons to clearly communicate pricing decisions, marketing strategy development, and business implementation phases. The 16:9 widescreen format includes two slides with an integrated data table section for combining visual flow with quantitative metrics and trend analysis.
Usage Points
-
Main Usage
Visualizes pricing decision processes, marketing strategy development, and business implementation phases through a five-stage circular flow. Each stage clearly presents value propositions, making it ideal for executive presentations, marketing team strategy sessions, and business performance reports.
-
How to Use
Customize each node's text and icons to match your specific strategy stages, then populate the data table below with numerical metrics and visual trend information. Maintain the brown color scheme or adapt it to your corporate brand colors for consistent presentation branding.
-
Recommended For
Marketing managers, business planning teams, executive presentations, investor pitch decks, and strategic planning meetings. Particularly effective for explaining pricing strategies, product launch phases, market entry plans, and other cyclical business processes.
-
Slide Structure
Five circular nodes connected by directional arrows in a continuous cycle. The central node (Value 03) serves as the focal point with two nodes positioned symmetrically on each side, creating balanced visual composition. A four-column data table at the bottom accommodates numerical input and trend visualization.
Related Products
-

Pricing Strategy Flow Diagram
#Business Strategy #Marketing Plan and Strategy #Diagram
-

Step-by-Step Pricing Strategy Presentation Slide
#Business Strategy #Marketing Plan and Strategy #Diagram
-

Pricing Strategy Step-by-Step Diagram
#Business Strategy #Marketing Plan and Strategy #Diagram
-

Setting a Sales Pricing Strategy – Effective Business Management
#Business Strategy #Marketing Plan and Strategy #Diagram
