Total Table Chart – Operations Planning and Business Management
RJ0900025_28
- Last Update 08/23/2025
- File Size 0.5MB
- # of Slides 2
- File Format PPTX
- Slide Ratio 16:9
- Color
Keywords
- #Content-Based Slides
- #Design-Based Slides
- #Business Management
- #Operational Plan
- #Diagram
- #Project Organization and Roles and Responsibilities
- #Capital Investment Plan
- #Table
- #Standard Table
- #16:9
- #table chart PowerPoint
- #comparison table slide template
- #operations planning presentation
- #business management slide
- #data organization template
- #multi-column table download
About the Product
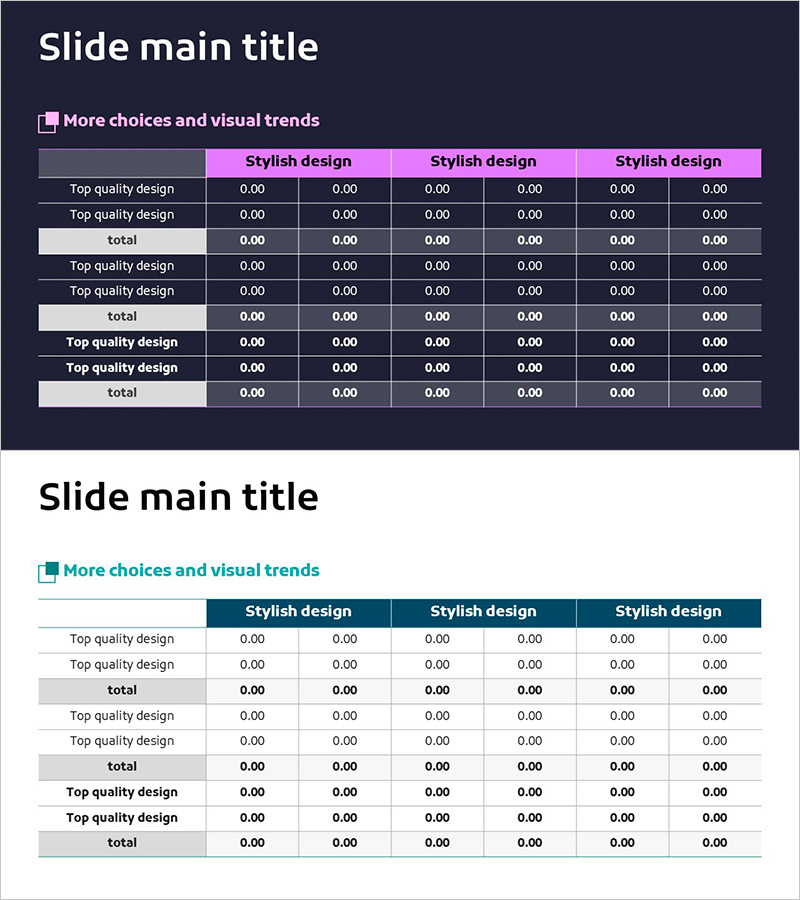
A multi-item comparison table PowerPoint slide designed for operations planning and business management. Built on a dark navy background with magenta headers, this 2-slide set features a 6-column by multi-row structure ideal for organizing complex operational data. Perfect for presenting equipment investment allocations, departmental responsibilities, budget distributions, and performance metrics in a clear, structured format. The 16:9 widescreen PPTX template is fully editable and ready for immediate use in executive presentations and strategic planning sessions.
Usage Points
-
Main Usage
Visualize multi-layered operational data—such as departmental budgets, project timelines, resource allocation, and performance metrics—in a structured table format to support executive decision-making. Ideal for management reports, strategy meetings, quarterly reviews, and business planning presentations requiring side-by-side data comparison.
-
How to Use
Enter operational details (department names, responsible parties, budgets, timelines, status) into each table cell. Use the magenta header row for category labels, white rows for subtotals and totals, and gray rows to visually separate sections. Easily add or remove rows and columns, and adjust colors to match your organization's branding and reporting standards.
-
Recommended For
Executives, project managers, operations directors, financial analysts, and organizational development specialists. Recommended for quarterly operations reports, budget allocation meetings, organizational structure presentations, and business performance analysis briefings.
-
Slide Structure
2-slide set. Slide 1: 6-column × 8-row table with magenta header, white subtotal rows, and gray divider rows. Slide 2: Alternative layout variation with modified header styling or cell arrangement. 16:9 widescreen format, fully editable PPTX with all cells customizable.
Related Products
-

Blue Orange Checklist – Diagram for Operational Planning
#Operational Plan #Diagram #Capital Investment Plan
-

Construction Order Status Table – Optimal Choice for Business Analysis
#Business Management #Market and Competitor Analysis #Diagram
-

Support Plan and Analysis Table for Operational Planning
#Operational Plan #Financial Plans and Performance #Diagram
-

Workload and Schedule Table – Efficient Task Management
#Product/Service Introduction #Business Management #Diagram
