Construction Permit and Construction Status Table – Operational Plan and Financial Performance
RJ0900015_16
- Last Update 08/20/2025
- File Size 0.6MB
- # of Slides 2
- File Format PPTX
- Slide Ratio 16:9
- Color
Keywords
- #Content-Based Slides
- #Design-Based Slides
- #Operational Plan
- #Financial Plans and Performance
- #Diagram
- #Capital Investment Plan
- #Capital Requirements
- #Table
- #Standard Table
- #16:9
- #construction permit table PowerPoint
- #groundbreaking status slide template
- #project data table PPT
- #operational plan table slide
- #financial performance table PowerPoint
- #construction project status template
About the Product
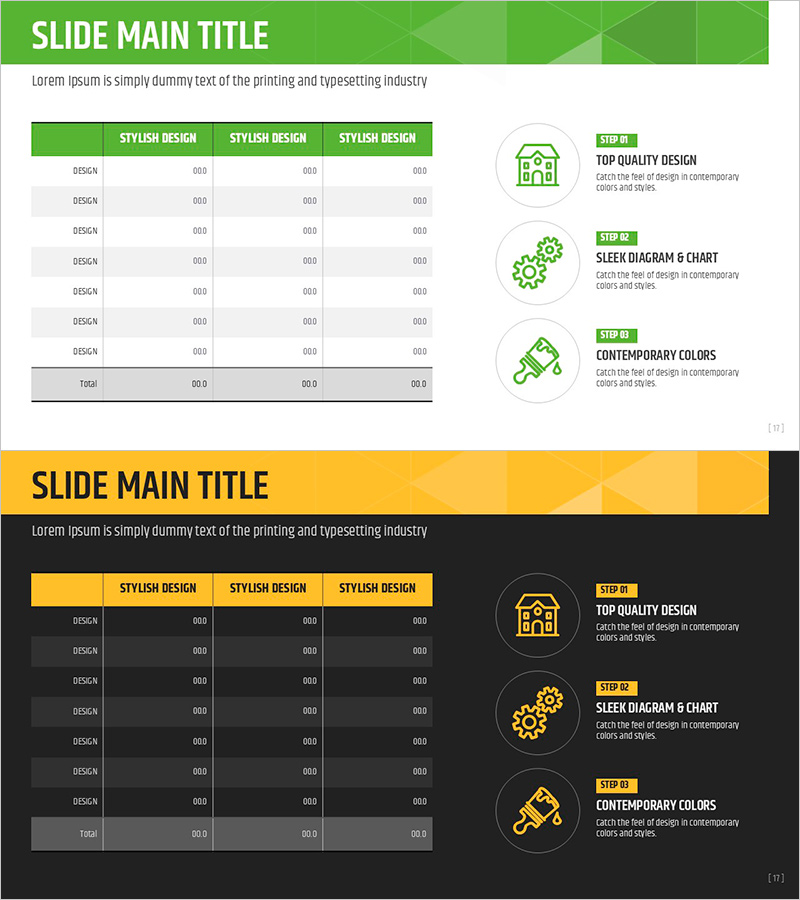
A table-format PowerPoint slide for organizing construction permits, groundbreaking status, operational plans, and financial performance data. Featuring a green header row and gray data rows in a 7-row by 3-column structure, this slide enables clear side-by-side comparison of project metrics, timelines, and budget allocations. Ideal for construction company project reports, real estate development presentations, investor briefings, and operational planning sessions where numerical data and progress tracking must be communicated with precision. The 2-slide deck is fully editable and optimized for 16:9 widescreen format.
Usage Points
-
Main Usage
Consolidates multiple project data points—permit status, groundbreaking date, completion timeline, operational metrics, and financial performance—into a structured table format that enhances stakeholder comprehension. Supports data-driven decision-making in project management meetings, investor presentations, and regulatory reporting.
-
How to Use
Enter column headers (permit status, groundbreaking date, completion date, budget, etc.) in the green header row. Populate each data row with project-specific information. Use the total row to aggregate statistics or summary figures. Customize colors and fonts to match corporate branding guidelines. All cells support text and numeric input.
-
Recommended For
Construction companies' project management teams, real estate developers' finance departments, financial institutions' project review teams, government construction policy officials, architectural firms' project managers, and investment presentation teams communicating project status and financial metrics to stakeholders.
-
Slide Structure
2-slide deck. Slide 1 features a green header row (3 columns) with 7 gray data rows plus a totals row for aggregated metrics. Slide 2 contains an identical table structure for comparative analysis across projects or time periods. All cells are fully editable with support for text and numerical data. Optimized for 16:9 widescreen presentation format.
Related Products
-

Curved Theme Purple Template Diagram – Investment Planning and Performance
#Financial Plans and Performance #Diagram #Capital Requirements
-

Estimated Budget Breakdown – Financial Planning and Budget Management
#Financial Plans and Performance #Diagram #Capital Requirements
-

Green Purple Funding Plan Table – Highlighting Financial Effectiveness
#Financial Plans and Performance #Diagram #Capital Requirements
-

Card Service Schedule – Emphasis on Financial Efficiency
#Financial Plans and Performance #Diagram #Capital Requirements
