Workload and Schedule Table – Efficient Task Management
RB0100075_6
- Last Update 03/07/2025
- File Size 0.3MB
- # of Slides 2
- File Format PPTX
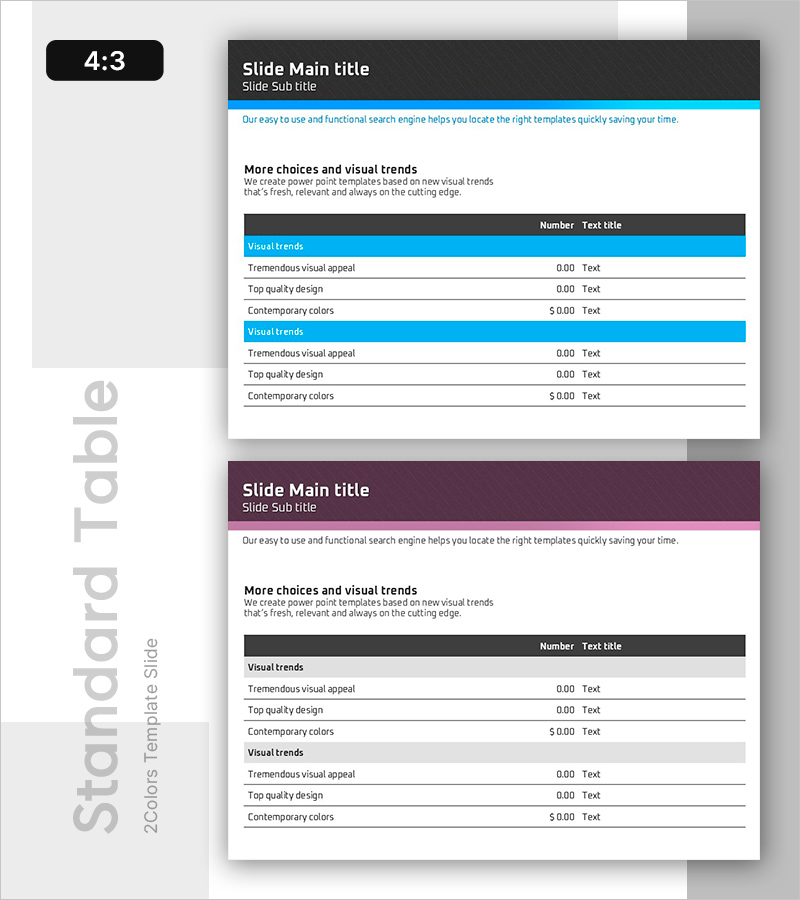
- Slide Ratio 4:3
- Color
Keywords
- #Content-Based Slides
- #Design-Based Slides
- #Product/Service Introduction
- #Business Management
- #Diagram
- #Development Plan
- #Project Organization and Roles and Responsibilities
- #Table
- #Standard Table
- #4:3
- #table PowerPoint slide
- #workload management presentation
- #schedule template
- #project management slide
- #horizontal table PPT
- #task tracking slide template
About the Product
A horizontal table PowerPoint slide designed to organize project workload and schedules at a glance. Featuring a blue header and clean white background, this slide clearly presents task items, metrics, and timelines for efficient project management. The 2-slide set is ready to use immediately for various business scenarios, with well-defined text input areas that reduce presentation preparation time. Ideal for business reports, project plans, status updates, and team presentations.
Usage Points
-
Main Usage
Organizes and visualizes project or team workload and schedules systematically. Enables comparison and review of task progress, assigned personnel, and estimated duration in a single table, improving workflow efficiency and ensuring transparent schedule management.
-
How to Use
Enter task names, assignees, estimated duration, and progress status into the table cells. Use the blue header row to label each column, then fill data rows with specific information. Add or remove rows and adjust column widths as needed to match your data volume and presentation requirements.
-
Recommended For
Project managers, team leads, and task coordinators presenting weekly or monthly status updates. Suitable for project proposals, business plans, executive reports, and team meeting presentations where clear visualization of task progress is essential.
-
Slide Structure
2-slide set with identical horizontal table layout. Each slide features a blue header row (2-column labels) and white background data rows (6+ rows minimum), with clearly defined text input areas for easy customization.
Related Products
-

Construction Order Status Table – Optimal Choice for Business Analysis
#Business Management #Market and Competitor Analysis #Diagram
-

Blue Red Table – Perfect Combination for Business Management and Financial Planning
#Business Management #Financial Plans and Performance #Diagram
-

Total Table Chart – Operations Planning and Business Management
#Business Management #Operational Plan #Diagram
-

Contact Customer Checklist Slide – Customer Analysis and Market Understanding
#Product/Service Introduction #Business Management #Market and Competitor Analysis
