Horizontal Bar Graph for Propulsion Performance – Strategic Alignment with Business Goals
RJ0900024_9
- Last Update 08/23/2025
- File Size 0.4MB
- # of Slides 2
- File Format PPTX
- Slide Ratio 16:9
- Color
Keywords
- #Content-Based Slides
- #Design-Based Slides
- #Business Vision and Strategy
- #Market and Competitor Analysis
- #Graph
- #Business Goals
- #Industry Trends
- #Horizontal Bar
- #Segmented Horizontal Bar
- #16:9
- #horizontal bar chart PowerPoint
- #bar graph slide template
- #performance comparison chart
- #business metrics visualization
- #data comparison presentation
About the Product
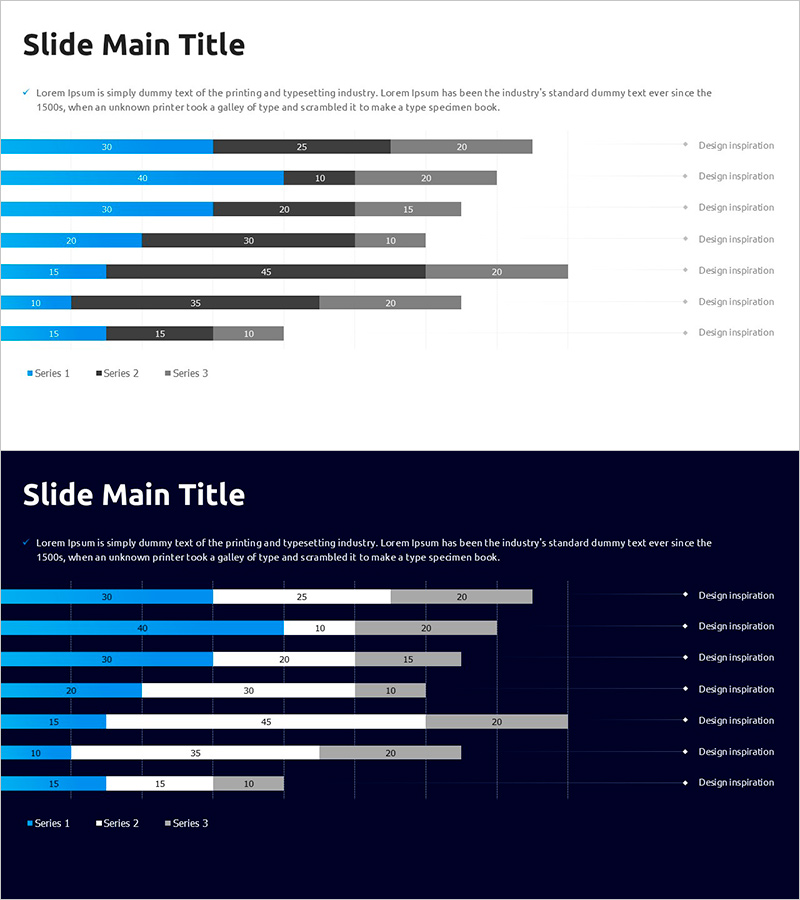
A horizontal bar chart PowerPoint slide designed to visualize business performance metrics and strategic alignment clearly. Displays 7 items with 3 data series (Series 1, 2, 3) in horizontal bars, making it ideal for comparing target vs. actual results, departmental performance, quarterly trends, and competitive benchmarking. Features a light gray background with cool blue primary data bars, black and gray secondary series for professional business presentations. Numeric labels on each bar ensure precise data readability. The 2-slide set provides flexibility to present multiple performance indicators and KPIs in reports, executive briefings, and strategy sessions.
Usage Points
-
Main Usage
Visualize business performance metrics, target vs. actual comparisons, departmental results, quarterly trends, and competitive analysis using horizontal bars. The 3-series format enables simultaneous display of multiple data sets for comprehensive performance analysis.
-
How to Use
Ideal for performance report sections, business plan presentations, executive briefings, quarterly review meetings, marketing campaign analysis, and sales target evaluations. Simply input your data and bar lengths adjust automatically. Supports data-driven decision-making in corporate settings.
-
Recommended For
Executives, managers, marketing and sales teams, project managers, finance and planning professionals, consultants, and educators who need to communicate quantitative results persuasively. Particularly effective when comparing actual performance against targets and goals.
-
Slide Structure
Slide 1: 7 items (rows) with 3 data series (Series 1, 2, 3) displayed as horizontal bars with numeric labels. Slide 2: Alternative design variant with dark navy background. 16:9 widescreen format, 2-slide PPTX file.
Related Products
-

Quarterly Analysis Bar Chart for Real Estate Volume
#Market and Competitor Analysis #Graph #Industry Trends
-

Stacked Bar Chart by Country – Visualizing Market Trends
#Market and Competitor Analysis #Graph #Other
-

Graphic Analysis of Safety Accidents – Market Insights and Trends
#Business Introduction #Market and Competitor Analysis #Graph
-

Technology Service Market Trends and Status – 100% Stacked Bar Chart
#Market and Competitor Analysis #Graph #Market Status
