Horizontal Bar Chart Slide for Four-Year Change Figures
RJ0800050_9
- Last Update 08/14/2025
- File Size 0.9MB
- # of Slides 2
- File Format PPTX
- Slide Ratio 16:9
- Color
Keywords
- #Content-Based Slides
- #Design-Based Slides
- #Market and Competitor Analysis
- #Graph
- #Industry Trends
- #Horizontal Bar
- #Segmented Horizontal Bar
- #16:9
- #horizontal bar chart PowerPoint
- #year-over-year comparison slide
- #stacked bar graph template
- #market analysis presentation
- #business trend visualization
- #four-year data PowerPoint slide
About the Product
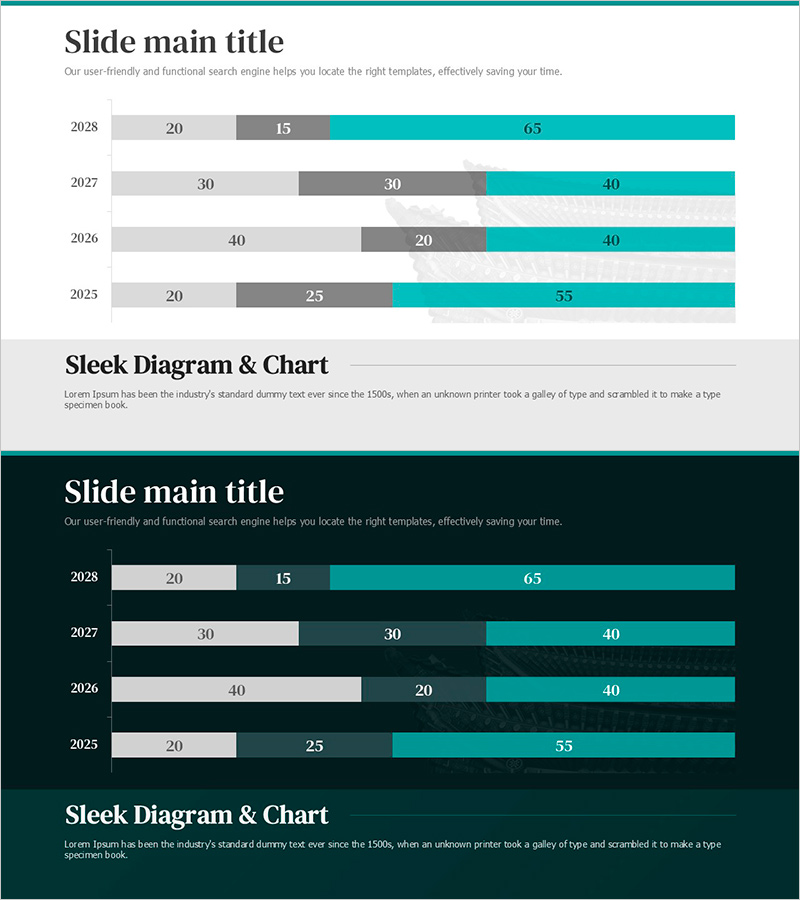
A PowerPoint slide visualizing four-year data trends from 2025 to 2028 using a horizontal stacked bar chart format. The design features three color series—light gray, dark gray, and teal—enabling clear year-over-year comparison and cumulative segment analysis. Delivered in 16:9 PPTX format with 2 slides, this template is ready for market analysis, competitive benchmarking, and business performance reporting presentations.
Usage Points
-
Main Usage
Display period-over-period numerical changes and communicate market trends or performance metrics at a glance. The stacked bar format simultaneously shows individual segment proportions and total magnitude shifts, making it ideal for presenting complex multi-series data.
-
How to Use
Insert into business reports, marketing plans, or investor presentations within market analysis or performance review sections. Replace sample data with actual figures, adjust colors to highlight key insights, and pair with speaker notes for data-driven narrative support during presentations.
-
Recommended For
Executives, marketing managers, business analysts, consultants, and sales leaders presenting market conditions, competitive positioning, or quarterly/annual performance results. Particularly effective for annual reviews, strategic planning sessions, and investor communications requiring quantitative evidence.
-
Slide Structure
Two-slide layout featuring horizontal stacked bar charts with four years (2025–2028) on the horizontal axis. Each bar is segmented into three color-coded categories (light gray, dark gray, teal), with numerical labels displayed on each segment for precise data interpretation and comparison.
Related Products
-

World Travel Template Horizontal Bar Segment Chart
#Market and Competitor Analysis #Graph #Industry Trends
-

Yellow Green Detailed Analysis Chart - Visualizing Market Trends
#Business Strategy #Market and Competitor Analysis #Diagram
-

Animal Natural Environment Improvement Rate Future Outlook Horizontal Bar Chart
#Market and Competitor Analysis #Graph #Industry Trends
-

Memorable Travel Destinations Survey Slide – Market and Competitive Analysis
#Market and Competitor Analysis #Graph #Industry Trends
