Comparative Analysis Line Graph – Market & Competitor Analysis
RJ0300096_27
- Last Update 05/16/2025
- File Size 0.6MB
- # of Slides 2
- File Format PPTX
- Slide Ratio 16:9
- Color
Keywords
About the Product
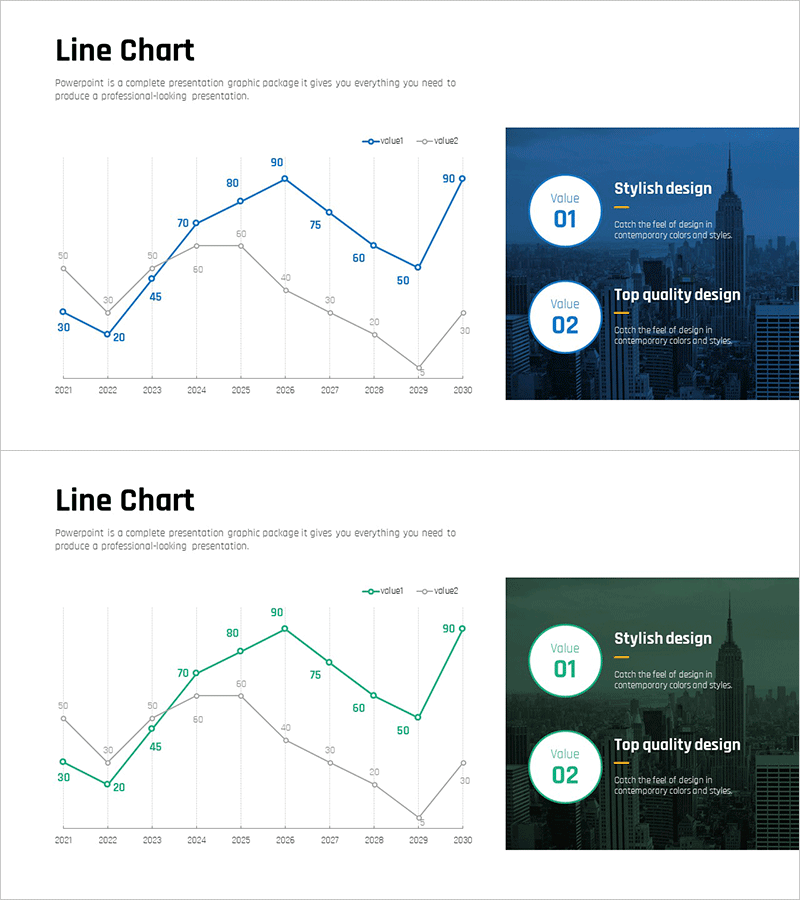
A PowerPoint slide featuring a dual-series line chart that compares market data and competitor performance side by side. The chart visualizes a 10-year trend from 2021 to 2030 using blue and gray lines, clearly showing growth rates, decline patterns, and performance variations. The slide includes data point labels and a legend for easy interpretation, making it ideal for market analysis, competitive positioning, and performance comparison sections in presentations. The 16:9 widescreen format with 2-slide layout adapts to various presentation environments and business contexts.
Usage Points
-
Main Usage
Compare market data and competitor performance across two data series simultaneously, highlighting trend changes and growth rate differences. The 10-year timeframe effectively illustrates long-term performance trajectories and market dynamics.
-
How to Use
Insert into business reports, marketing strategy presentations, or investor pitch decks in the market analysis section. Data labels and legend are pre-positioned; simply replace the values with your own figures. Customize the blue and gray color scheme to match your corporate branding.
-
Recommended For
Marketing professionals, strategy planners, financial analysts, and executives presenting market conditions and competitive positioning. Ideal for quarterly or annual performance comparisons, industry trend analysis, and competitive advantage assessments.
-
Slide Structure
Composed of two line series (blue and gray) with X-axis showing years 2021–2030 (10 data points) and Y-axis ranging from 0 to 90. Each data point displays a numeric label. A right-side panel contains Value 01 and Value 02 explanation areas for additional context.
Related Products
-

Korea China Japan Analysis Graph – Market Competitive Advantage
#Market and Competitor Analysis #Graph #Other
-

Neon Tone Competitor Analysis Broken Line Graph
#Market and Competitor Analysis #Graph #Competitor Analysis
-

Default Line Graph for Market & Competitor Analysis – Competitive Advantage
#Market and Competitor Analysis #Graph #Competitor Analysis
-

Broken Line Comparison Graph – Optimized for Market and Competitor Analysis
#Market and Competitor Analysis #Graph #Competitor Analysis
