VR Business Market Analysis Broken Line Graph – Competitive Advantage and Trend Analysis
RJ0400050_6
- Last Update 05/31/2025
- File Size 1.6MB
- # of Slides 2
- File Format PPTX
- Slide Ratio 16:9
- Color
Keywords
- #Content-Based Slides
- #Design-Based Slides
- #Market and Competitor Analysis
- #Graph
- #Competitor Analysis
- #Competitive Advantage
- #Line
- #Line Chart
- #16:9
- #broken line chart PowerPoint
- #market analysis slide template
- #3-series trend graph
- #competitive analysis chart
- #market data visualization
- #PowerPoint graph slide download
About the Product
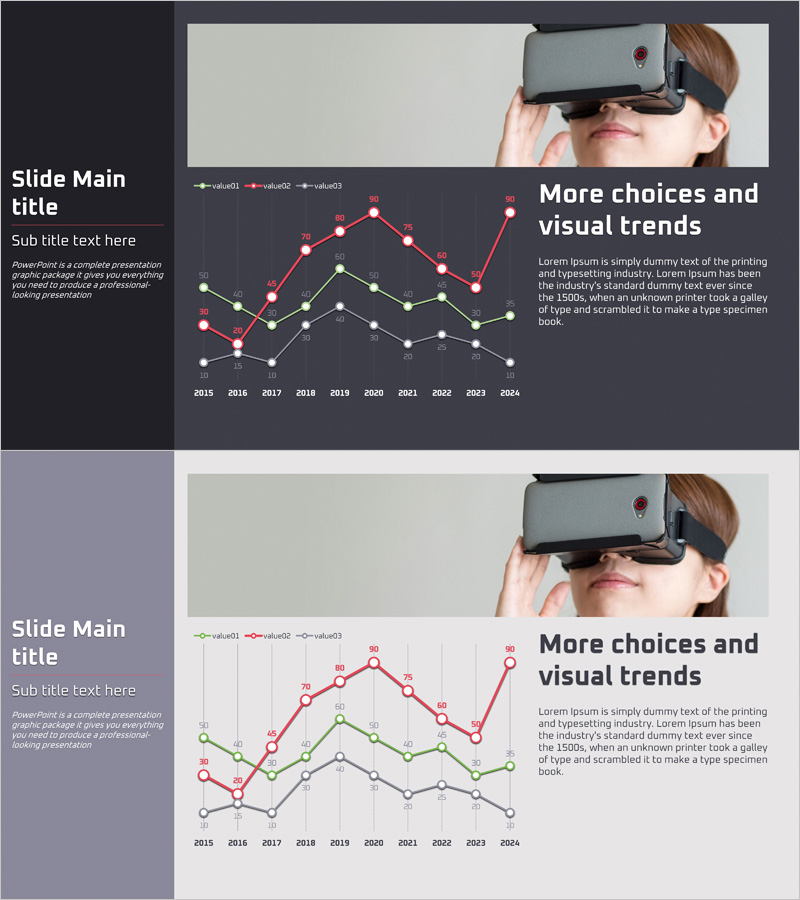
A PowerPoint slide featuring a broken line chart for VR business market analysis. This presentation template visualizes 10 years of data from 2015 to 2024 across three data series using red, green, and gray lines, clearly representing competitive trends and market movements. The dark background with white typography and colored lines creates high contrast suitable for immediate use in presentations. The 2-slide set offers multiple data visualization approaches with embedded data labels and legends, making it ideal for market analysis reports, executive briefings, investor pitch decks, and strategic planning documents.
Usage Points
-
Main Usage
This slide is optimized for comparing market trends and competitive dynamics over time. The three broken lines represent different data series (e.g., company vs. competitors A and B, or market size vs. growth rate vs. market share), allowing viewers to grasp decade-long trend changes at a glance.
-
How to Use
Use in business plans, market analysis reports, investor presentations (IR), and executive briefings to explain competitive advantages and market growth potential. The professional dark-background design works for both large conference room projections and online presentations. Data labels are fully editable to match your company's specific metrics.
-
Recommended For
Strategic planning teams, marketing departments, sales teams, executive report managers, investor relations specialists, and consulting analysts preparing market analysis materials. Particularly effective for business plans and market analysis presentations in emerging tech sectors such as VR, AR, metaverse, and IT industries.
-
Slide Structure
2-slide set: the first slide features a dark background with three broken lines connecting 10 data points from 2015 to 2024. The second slide presents the same data on a light background with embedded data labels and legend. Both slides are formatted in 16:9 widescreen ratio, optimized for modern presentation environments.
Related Products
-

Fantastic Wide PowerPoint Line Chart – Ideal for Market Analysis
#Market and Competitor Analysis #Graph #Competitor Analysis
-

Business Competitor Analysis Graph – Visualizing Market Competitive Advantage
#Market and Competitor Analysis #Graph #Competitor Analysis
-

Line Graph for Comparative Analysis – Highlighting Competitive Advantage
#Market and Competitor Analysis #Graph #Competitor Analysis
-

Purple Orange Curved Line Chart – Visualizing Competitive Edge
#Market and Competitor Analysis #Graph #Competitor Analysis
