Propulsion Plan Linear Diagram – A Visual Tool for Business Operations
RJ0900023_28
- Last Update 08/23/2025
- File Size 2.5MB
- # of Slides 2
- File Format PPTX
- Slide Ratio 16:9
- Color
Keywords
- #Content-Based Slides
- #Design-Based Slides
- #Business Management
- #Operational Plan
- #Diagram
- #Implementation Schedule
- #Project Implementation Schedule
- #Flow
- #Linear Flow
- #16:9
- #linear diagram PowerPoint
- #propulsion plan presentation
- #3-stage flowchart slide
- #business timeline diagram
- #operational planning PowerPoint template
About the Product
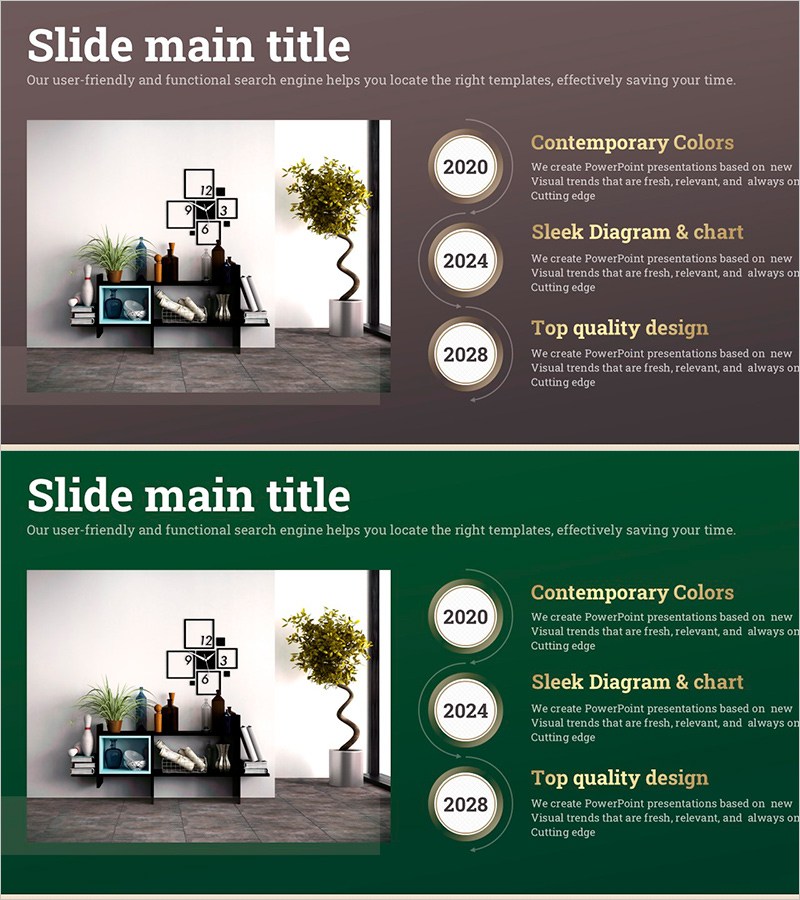
A linear diagram PowerPoint slide that visualizes business propulsion schedules and operational plans in sequential stages. This 2-slide set features a three-node arrow flowchart and a year-by-year timeline layout. The design uses a brown background with beige and gold-toned circular nodes connected by black directional arrows, clearly showing process progression. Each stage includes dedicated text input areas for detailed information. This PowerPoint slide is ready to use for corporate strategy presentations, project timeline management, business roadmap announcements, and operational planning discussions.
Usage Points
-
Main Usage
Visualizes business propulsion strategies and operational plans as sequential stage flows to enhance audience understanding. The three-node connection structure clearly communicates process direction, allowing each stage to display objectives, timelines, and responsible departments for organization-wide strategy alignment.
-
How to Use
Enter stage names (Stage 1, Stage 2, Stage 3) and detailed content in each node. Input timeline information by year, quarter, or month in the timeline layout to track project progress. Use as presentation slides for meetings, reports, and strategy announcements. Color modifications enable department or project differentiation.
-
Recommended For
Executives, business management teams, project leaders, and operations managers use this for strategy meetings, quarterly reports, and new business proposals. Ideal for presentations requiring phased implementation such as long-term business plans, organizational restructuring timelines, and system deployment roadmaps.
-
Slide Structure
Slide 1: Three circular nodes connected left-to-right with black directional arrows in linear flowchart format. Text input areas positioned below each node. Slide 2: Year-by-year timeline layout displaying 2020, 2024, and 2028 with dedicated input sections for each year's details. Brown background throughout with beige and gold accent tones.
Related Products
-

Effectiveness Analysis Plan Diagram
#Business Management #Operational Plan #Diagram
-

Linear Diagram Slide for Future Food Service Project Promotion Plan
#Business Management #Operational Plan #Diagram
-

Schedule Chart for Goals – Visualizing Business Plans and Timelines
#Business Management #Operational Plan #Diagram
-

Schedule Planning Arrow Linear Diagram – Efficiency in Business Operations
#Business Management #Operational Plan #Diagram
