Linear Diagram Slide for Future Food Service Project Promotion Plan
RJ0800042_26
- Last Update 08/12/2025
- File Size 0.9MB
- # of Slides 2
- File Format PPTX
- Slide Ratio 16:9
- Color
Keywords
- #Content-Based Slides
- #Design-Based Slides
- #Business Management
- #Operational Plan
- #Diagram
- #Implementation Schedule
- #Project Implementation Schedule
- #Flow
- #Cluster
- #Linear Flow
- #Chain Diagram
- #16:9
- #linear diagram PowerPoint
- #connection diagram slide
- #3-step timeline diagram
- #business promotion plan PPT
- #project roadmap slide template
About the Product
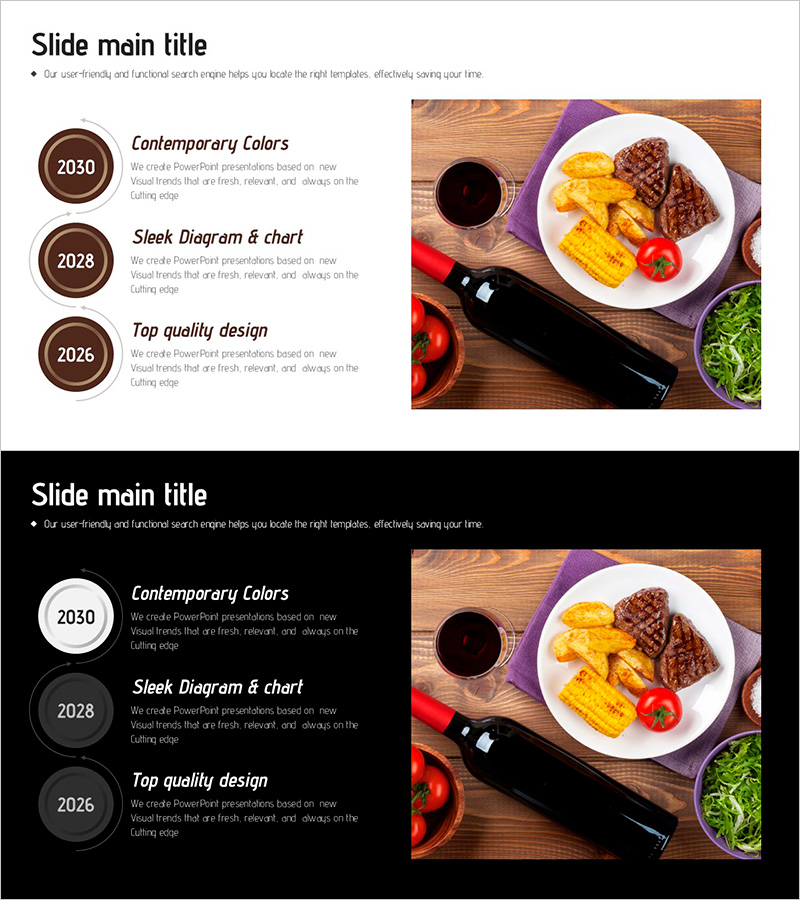
A 3-step linear connection diagram PowerPoint slide designed to visualize future food service business promotion plans. Brown circular nodes display years (2030, 2028, 2026) with connecting lines showing sequential flow, while the right side features an image area for supporting visuals. Provided in 16:9 widescreen PPTX format with clearly separated text and image zones for immediate customization. Ideal for business plan presentations, marketing strategy development, project roadmaps, and corporate communications. Easily edit text, colors, and images to match your brand identity and presentation content.
Usage Points
-
Main Usage
Visualize future business promotion plans, project roadmaps, and phased strategies using this linear connection diagram. Three brown circular nodes represent sequential stages with connecting lines, allowing you to input key information at each phase and deliver clear messages to your audience.
-
How to Use
Open the slide and enter your business phases, milestones, or goals into the circular nodes and adjacent text areas. Insert relevant photos, charts, or graphics into the right-side image zone to enhance visual impact. Customize colors, fonts, and layouts to align with your corporate branding and presentation style.
-
Recommended For
Ideal for food service entrepreneurs, marketing managers, project managers, and executives preparing business reports. Perfect for business plans, investor pitch decks, strategic planning meetings, and project status presentations where phased progression needs clear visual explanation.
-
Slide Structure
2-slide set featuring a left-aligned vertical arrangement of 3 brown circular nodes (2030, 2028, 2026) connected by lines, with a dedicated image area on the right. Each node includes adjacent text fields for titles and descriptions, creating a clean, professional timeline layout.
Related Products
-

Smart Travel App Company History - Harmony of Mint and Purple
#Company Introduction #Business Management #Diagram
-

Business Progress Schedule Arrow Diagram – A Clear Start for Strategy
#Business Management #Operational Plan #Diagram
-

Connected Future Planning – Blueprint for Business Strategy
#Business Strategy #Business Management #Diagram
-

Timeline Chart Visualizing Yearly Changes – Journey of Success
#Company Introduction #Operational Plan #Diagram
