Schedule Chart for Goals – Visualizing Business Plans and Timelines
RJ0500007_18
- Last Update 06/09/2025
- File Size 1.2MB
- # of Slides 2
- File Format PPTX
- Slide Ratio 16:9
- Color
Keywords
- #Content-Based Slides
- #Design-Based Slides
- #Business Management
- #Operational Plan
- #Diagram
- #Implementation Schedule
- #Project Implementation Schedule
- #Flow
- #Table
- #Linear Flow
- #Standard Table
- #16:9
- #schedule table PowerPoint slide
- #project timeline diagram
- #business plan timeline template
- #weekly schedule chart
- #horizontal Gantt chart PowerPoint
About the Product
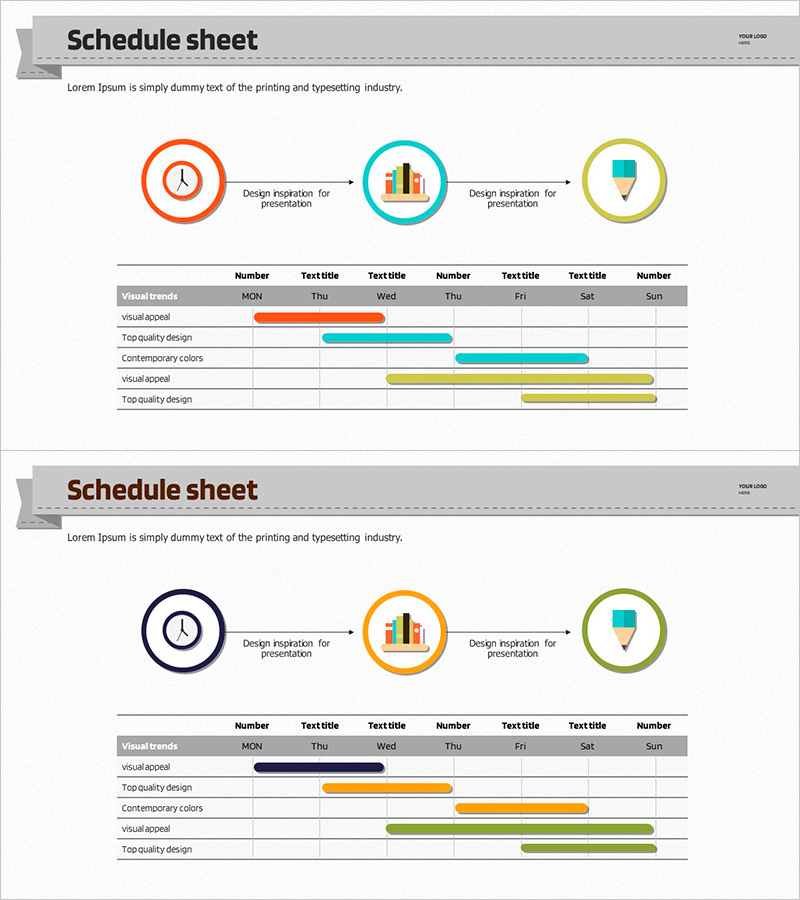
A horizontal schedule table PowerPoint slide designed to visualize project timelines and operational plans for achieving business goals. The slide features three distinct phases represented by orange, cyan, and yellow color-coded bars, with three circular icons at the top (clock, bar chart, funnel) indicating the design intent of each phase. The layout combines a weekly timeline table with phase-based progress visualization, making it ideal for business plans, operational reports, and project presentations. Fully editable and ready to use across various corporate presentation contexts.
Usage Points
-
Main Usage
Visualizes project phases and operational timelines to communicate business goals and project milestones clearly. The color-coded structure helps stakeholders understand project duration, phase dependencies, and key deliverables at a glance.
-
How to Use
Use the three circular icons at the top to explain each phase's purpose. Update the horizontal bars to reflect actual project timelines and modify colors to match your organization's branding. Fill in the weekly table below with specific tasks, responsible parties, and milestones for each phase.
-
Recommended For
Ideal for business plans, project management reports, operational plans, and marketing strategy presentations. Recommended for executives, project managers, marketing professionals, and planning teams presenting project progress and timelines.
-
Slide Structure
Title area + 3 circular icons (clock, bar chart, funnel) + 3-color horizontal schedule bars (orange, cyan, yellow) + weekly table grid (7 columns for days, 5 rows for tasks). Two-slide set offering multiple timeline visualization options.
Related Products
-

AI Implementation Roadmap PowerPoint Slide – 12-Week Matrix
#Business Strategy #Business Management #Operational Plan
-

Propulsion Plan Linear Diagram – A Visual Tool for Business Operations
#Business Management #Operational Plan #Diagram
-

Schedule Slide Template for Efficient Journeys
#Business Management #Operational Plan #Diagram
-

Effective Schedule of Trials Template - Business Management and Operational Planning
#Business Management #Operational Plan #Diagram
