Visualizing Four-Year Change in Sales – An Effective Tool for Market Analysis
RJ0900022_22
- Last Update 08/22/2025
- File Size 0.4MB
- # of Slides 2
- File Format PPTX
- Slide Ratio 16:9
- Color
Keywords
- #Content-Based Slides
- #Design-Based Slides
- #Market and Competitor Analysis
- #Graph
- #Market Analysis
- #Industry Trends
- #Column
- #Segmented Column
- #16:9
- #stacked bar chart PowerPoint
- #sales trend visualization
- #4-year data analysis slide
- #how to create stacked bar chart in PowerPoint
- #financial report template
About the Product
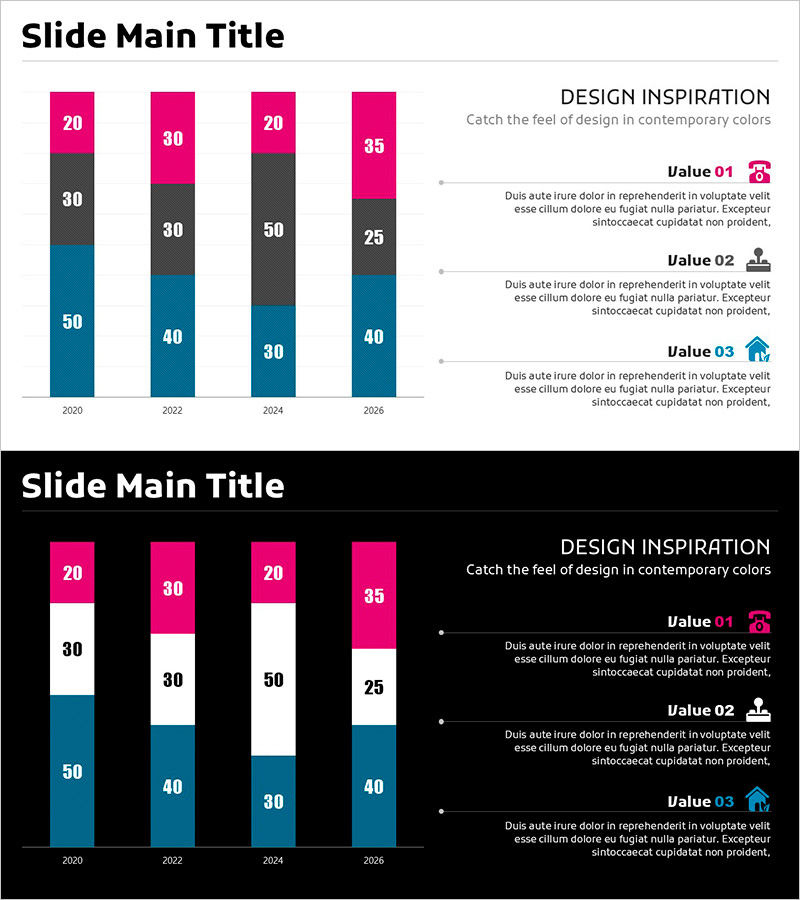
A stacked bar chart PowerPoint slide visualizing four-year sales changes with three data series in navy blue, dark gray, and magenta. Each bar displays numerical values for precise data comparison across years 2020–2026. This presentation template includes two versions: white background and black background, allowing flexible integration into any presentation theme. Ideal for market analysis reports, sales performance reviews, business presentations, and financial summaries where quantitative trends need clear visual emphasis.
Usage Points
-
Main Usage
This slide effectively compares year-over-year sales composition changes using a stacked bar chart format. It simultaneously displays total volume and individual series contribution, making it ideal for market trend analysis, business performance evaluation, and financial status presentations.
-
How to Use
Double-click the data area to replace values with your actual figures. Select the white background version for light-themed presentations or the black version for dark-themed decks. All bar colors and numerical labels are fully editable to match your branding.
-
Recommended For
Finance teams presenting quarterly or annual results, marketing departments analyzing channel-based revenue, executive leadership reporting business performance, investor presentations demonstrating growth, and strategic planning sessions requiring multi-series data comparison.
-
Slide Structure
Four-year data (2020–2026) displayed as stacked bars with three color-coded series: navy blue, dark gray, and magenta. Numerical values appear above each segment. Right side includes Value 01, 02, 03 legend with descriptive text areas. Two background options provided.
Related Products
-

Visualization of Learning Response Data – Market Trend Analysis
#Market and Competitor Analysis #Graph #Future Outlook
-

Pork Consumption Stack Chart – Market Trend Analysis
#Market and Competitor Analysis #Graph #Market Analysis
-

3D Segmented Bar Graph for Performance Analysis – Market Trends
#Market and Competitor Analysis #Graph #Customer Analysis
-

Market Trends and Analysis Green Navy – Clearly Displaying Market Trends
#Market and Competitor Analysis #Graph #Market Analysis
