Stereographic Segmentation Bar Chart – Visualization of Market Analysis and Trends
RJ0600010_8
- Last Update 06/23/2025
- File Size 0.3MB
- # of Slides 2
- File Format PPTX
- Slide Ratio 16:9
- Color
Keywords
About the Product
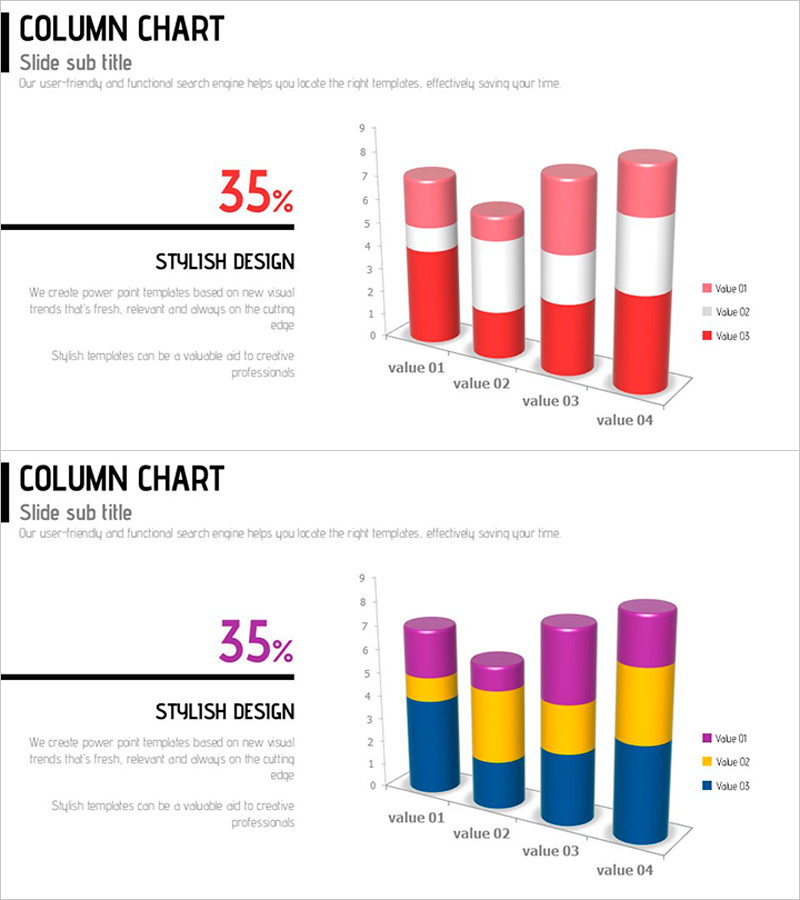
A three-dimensional segmented column chart PowerPoint slide designed for multi-series data comparison. Features red, pink, and white color gradients across four data series, ideal for visualizing market trends, competitive analysis, and sales performance metrics. The stacked vertical bar structure enables simultaneous display of total volume and internal composition breakdown. Ready-to-use presentation slide for business reports, strategic proposals, and quarterly performance reviews requiring quantitative data emphasis.
Usage Points
-
Main Usage
Compare multiple data series (3-4 categories) using 3D stacked columns to communicate market size, growth rates, and competitive positioning intuitively. Increases audience engagement in quantitative analysis sections.
-
How to Use
Input your data values by adjusting bar heights and color series. Reference the legend (Value 01-03) and modify axis labels (value 01-04) to match your presentation context. Customize colors and text as needed.
-
Recommended For
Recommended for executives, marketing teams, sales departments, and finance professionals presenting quarterly results, market share, customer satisfaction scores, and product sales volumes. Ideal for investor presentations, strategy meetings, and performance reviews requiring credible data representation.
-
Slide Structure
Two-slide layout. Each slide displays four columns (value 01-04) with three stacked data series (Value 01, 02, 03) in 3D perspective. Left side features 35% emphasis text and 'Stylish Design' description area; right side showcases the 3D column chart visualization.
Related Products
-

5-Year Real Estate Volume Chart – Market Analysis
#Market and Competitor Analysis #Graph #Market Analysis
-

Pork Consumption Stack Chart – Market Trend Analysis
#Market and Competitor Analysis #Graph #Market Analysis
-

Analysis of 3D Printing Progress – Market Trends and Insights
#Market and Competitor Analysis #Graph #Market Analysis
-

Market Trends and Analysis Green Navy – Clearly Displaying Market Trends
#Market and Competitor Analysis #Graph #Market Analysis
