Furniture Donut Charts – Market Share Analysis
RJ0900021_6
- Last Update 08/22/2025
- File Size 0.4MB
- # of Slides 2
- File Format PPTX
- Slide Ratio 16:9
- Color
Keywords
About the Product
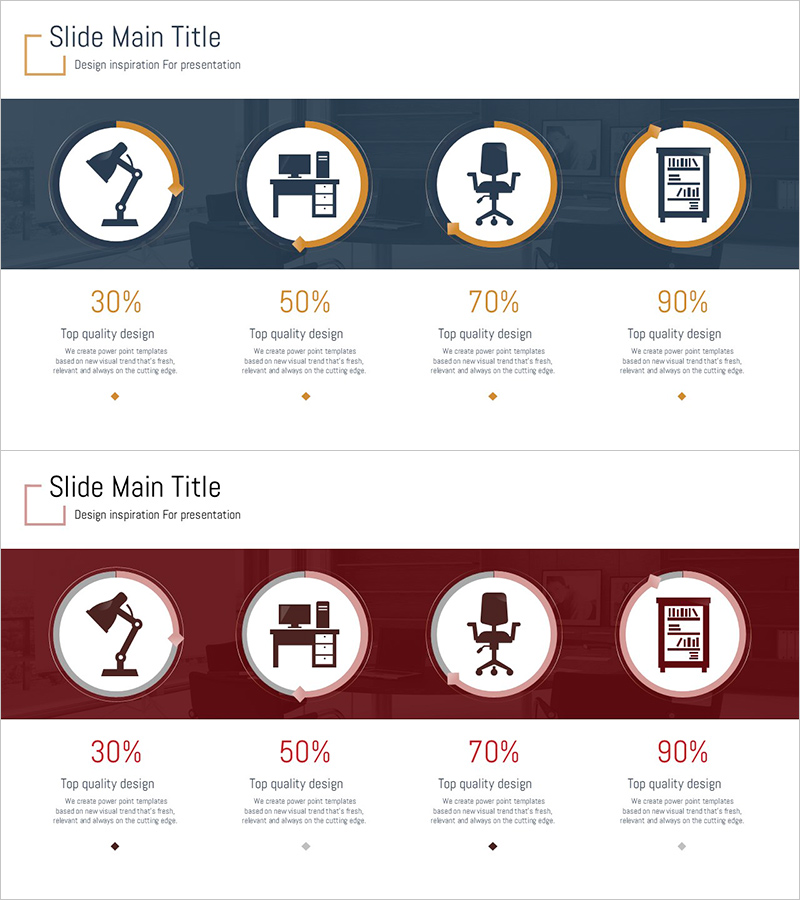
A professional PowerPoint slide featuring four donut charts to visualize market share distribution across product categories or competitors. Set against a dark blue background with gold-bordered circular frames, this slide template displays percentage breakdowns (30%, 50%, 70%, 90%) with crystal clarity. Ideal for sales presentations, market analysis reports, and business proposals in furniture, real estate, retail, and finance sectors. Delivered in 16:9 widescreen PPTX format, fully editable across all PowerPoint versions. Customize colors, percentages, and labels to match your specific data and branding requirements.
Usage Points
-
Main Usage
Effectively communicate proportional relationships across four categories—market share, sales distribution, customer demographics, or budget allocation—at a glance. The hollow center of each donut chart provides space for key metrics or titles, enhancing information hierarchy and visual impact.
-
How to Use
Deploy in sales presentations, quarterly business reviews, market research reports, and strategic planning sessions to compare competitor positioning, analyze customer segments, or break down product revenue. Simply double-click chart sections to edit percentages, colors, and labels directly within PowerPoint, reflecting real-time data without design skills.
-
Recommended For
Marketing professionals, sales managers, business analysts, and management consultants presenting to executives and stakeholders. Particularly suited for furniture, real estate, retail, finance, and manufacturing industries requiring market analysis, competitive positioning, or financial performance visualization.
-
Slide Structure
Two-slide set. Slide 1: Dark blue background with four horizontally arranged donut charts displaying 30%, 50%, 70%, and 90% distributions, each framed by gold-bordered circles. Slide 2: Identical layout with wine-red background. Both slides include descriptive text areas below charts for context and annotations.
Related Products
-

How to Protect Your Environment Pie Chart
#Market and Competitor Analysis #Graph #Market Status
-

Logistics Market Share Chart – Current Status and Competitive Analysis
#Market and Competitor Analysis #Graph #Market Status
-

Visualizing Value Ratios with Pie Charts – Essential Presentation Template
#Market and Competitor Analysis #Diagram #Graph
-

Visualizing Fish Market Share with Doughnut Chart – Vitality of the Ocean
#Market and Competitor Analysis #Graph #Market Status
