How to Protect Your Environment Pie Chart
RJ0600097_9
- Last Update 07/17/2025
- File Size 1.9MB
- # of Slides 2
- File Format PPTX
- Slide Ratio 16:9
- Color
Keywords
About the Product
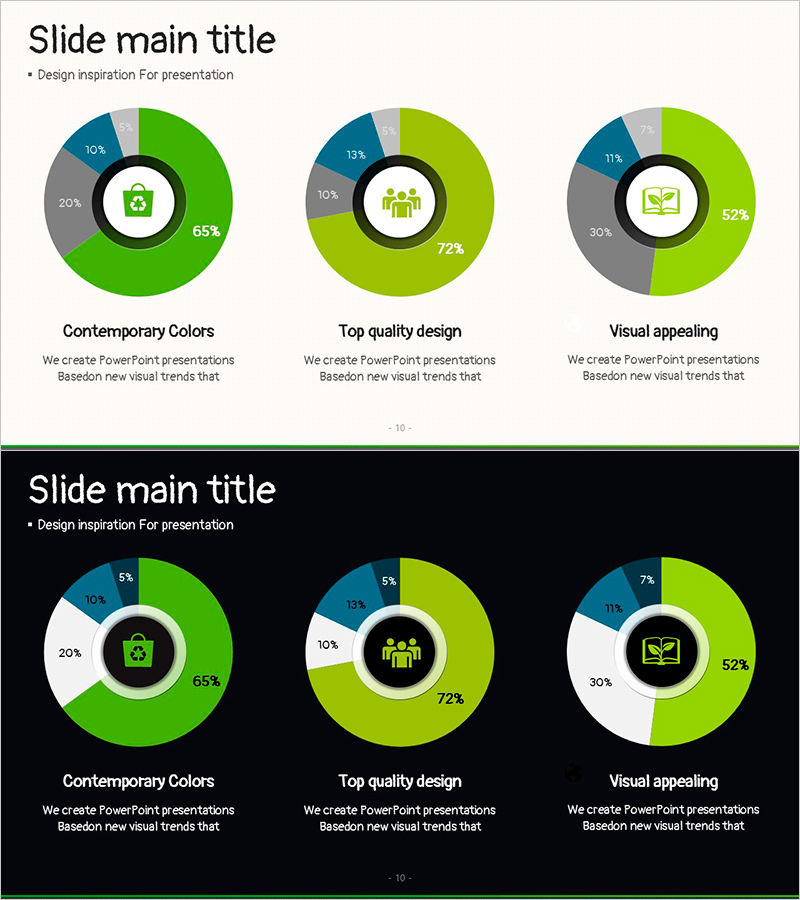
A donut-shaped pie chart PowerPoint slide designed to visually represent composition ratios, market share, and percentage distribution. The chart features three segments in lime green, dark blue, and gray tones, with a central icon area to emphasize category meanings. This 2-slide set includes both light and dark background versions, allowing you to match your presentation's overall design tone. Each chart section displays percentage values and descriptive text that can be immediately customized. You can freely modify colors, numerical data, and icons using standard PowerPoint editing tools without requiring design software.
Usage Points
-
Main Usage
This donut chart is optimized for clearly visualizing composition ratios, market share, and category distribution. The central icon area symbolically represents the topic, while percentage values in each segment convey quantitative information. Particularly effective for environmental protection, sustainability, and corporate social responsibility presentations.
-
How to Use
Replace the percentage values in each chart segment with your own data. Swap the central icon for an image relevant to your topic. Colors (lime green, dark blue, gray) can be freely adjusted through PowerPoint's shape formatting options. Choose between light or dark background versions to match your overall slide design theme.
-
Recommended For
Ideal for environmental and energy sector presentations, market share and customer distribution analysis reports, product component explanations, organizational role allocation displays, budget allocation reports, and any presentation requiring ratio-based information delivery.
-
Slide Structure
The 2-slide set features three donut pie charts per slide, each divided into 3 segments with a central icon area. Slide 1 uses a light background with lime green, dark blue, and gray segments. Slide 2 applies the same color scheme on a dark background, providing flexibility for different presentation environments.
Related Products
-

Guide to Admission Evaluation Criteria with Donut Chart
#Market and Competitor Analysis #Graph #Market Status
-

Visualizing Value Ratios with Pie Charts – Essential Presentation Template
#Market and Competitor Analysis #Diagram #Graph
-

Donut Chart for Components and Market Share Visualization – Market Analysis
#Market and Competitor Analysis #Graph #Market Status
-

Market Share Analysis Graph by Technology – Competition and Collaboration
#Market and Competitor Analysis #Diagram #Graph
