Lighting Graph – Market Share and Target Analysis
RJ0900021_17
- Last Update 08/22/2025
- File Size 0.5MB
- # of Slides 2
- File Format PPTX
- Slide Ratio 16:9
- Color
Keywords
About the Product
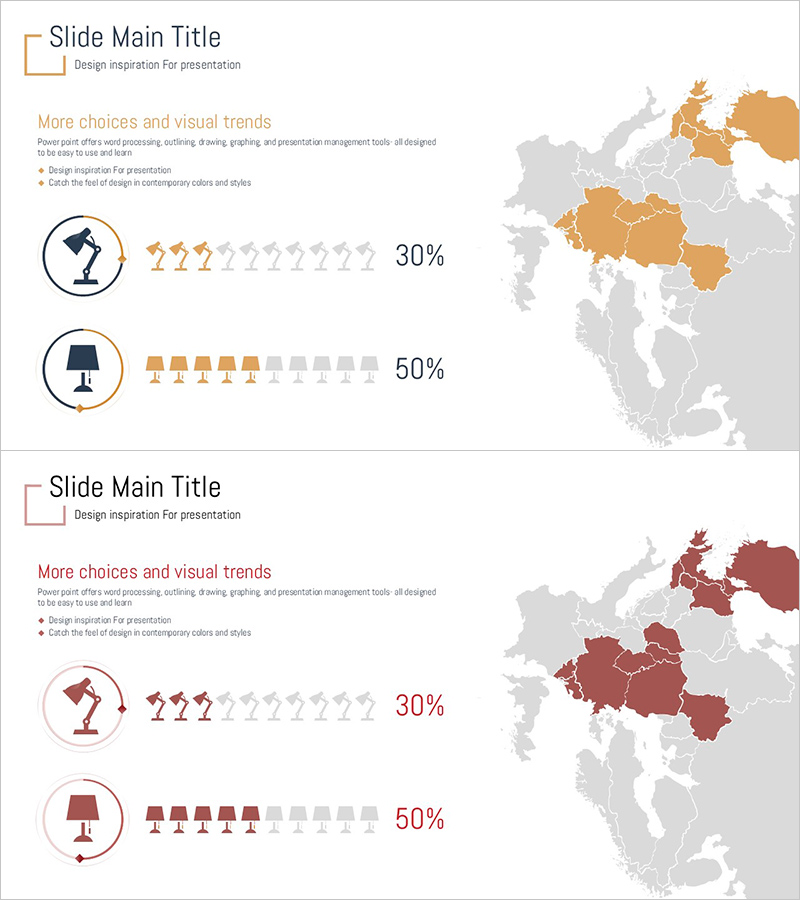
A donut chart PowerPoint slide designed for market share and target audience analysis. This 2-slide presentation template features two color versions—warm orange and wine red—combining circular pie charts with regional map visualization and icon-based percentage representation. Ideal for market analysis presentations in lighting, consumer goods, retail, and distribution sectors. The 16:9 widescreen PPTX format ensures compatibility across all devices and is ready for immediate editing and data integration.
Usage Points
-
Main Usage
Visualize market share, customer composition, and product distribution ratios using donut-shaped pie charts. Combine regional map data with icon-based percentage indicators to present both quantitative metrics and geographic distribution simultaneously.
-
How to Use
Apply to marketing strategy presentations, market analysis reports, and business plan market overview sections. Use for competitive market share comparison, customer demographic breakdown, and regional sales distribution. Directly input your data and percentages for instant customization.
-
Recommended For
Marketing managers, sales strategists, business development executives, market research analysts, and consulting teams. Suitable for market analysis presentations across consumer goods, retail, IT, finance, lighting, and construction industries.
-
Slide Structure
2-slide set with consistent layout: left side features a 2-segment donut pie chart, right side displays a regional Europe map with color-coded areas, and bottom section shows icon-based percentage bars. Orange and wine color versions provided for flexible presentation styling.
Related Products
-

Share Chart by Region – Market Analysis Tool
#Market and Competitor Analysis #Graph #Other
-

Donut Chart Slide Visualizing Crime Frequency by Region
#Market and Competitor Analysis #Graph #Other
-

Donut Chart Slide Visualizing Target Market Development Status
#Market and Competitor Analysis #Graph #Other
-

Target Market Map for the US Space Industry – Market Analysis Slide
#Market and Competitor Analysis #Graph #Other
