Target Market Share Analysis - Data Visualization with Graphs
RJ0600092_26
- Last Update 07/15/2025
- File Size 0.6MB
- # of Slides 2
- File Format PPTX
- Slide Ratio 16:9
- Color
Keywords
About the Product
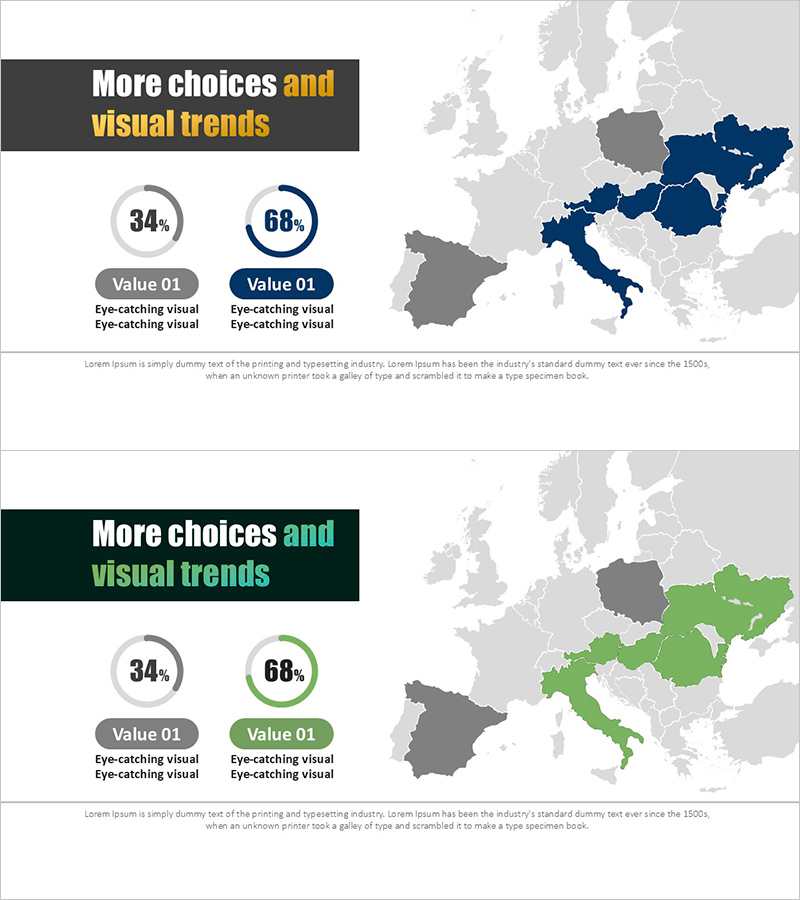
A 2-slide PowerPoint presentation featuring donut-shaped pie charts to visualize European market share distribution. The slides use navy blue and gray color contrasts to clearly represent data ratios of 34% and 68% respectively. Formatted in PPTX with 16:9 widescreen aspect ratio, these slides are optimized for modern presentation environments. Ideal for market analysis presentations, target market entry strategies, and regional market share comparisons that require immediate deployment.
Usage Points
-
Main Usage
Intuitively express regional and competitive market share comparisons using donut-shaped pie charts. The two-segment data structure (34% and 68%) is optimized for comparing major market segments, making it ideal for executive reports, investor presentations, and marketing strategy briefings where key metrics need emphasis.
-
How to Use
Double-click the donut chart area on each slide to edit the data. Replace legend labels and numerical values with your actual market data, and adjust colors as needed to match your corporate brand. Combine with regional maps to create comprehensive regional market share analysis slides.
-
Recommended For
Marketing managers, business development teams, and executives presenting market entry strategies, competitive analysis, and business performance reports. Particularly effective for regional market analysis (Europe, Asia), new business target market definition, and quarterly performance comparison presentations.
-
Slide Structure
2-slide layout with one donut chart per slide. First slide displays 34% ratio, second slide shows 68% ratio, using navy blue, gray, and light tone color palette for clear data differentiation. Each chart includes legend and numerical label input areas below for easy insertion of actual market data.
Related Products
-

Target Country Market Share Analysis Graph
#Market and Competitor Analysis #Graph #Other
-

European Target Market Status Graph – Market Share Insights
#Market and Competitor Analysis #Graph #Other
-

Donut Chart Slide Visualizing Target Market Development Status
#Market and Competitor Analysis #Graph #Other
-

Target Market Map for the US Space Industry – Market Analysis Slide
#Market and Competitor Analysis #Graph #Other
