Bathroom Demand Survey Graph – Donut Chart for Market Analysis
RJ0900021_13
- Last Update 08/22/2025
- File Size 0.2MB
- # of Slides 2
- File Format PPTX
- Slide Ratio 16:9
- Color
Keywords
About the Product
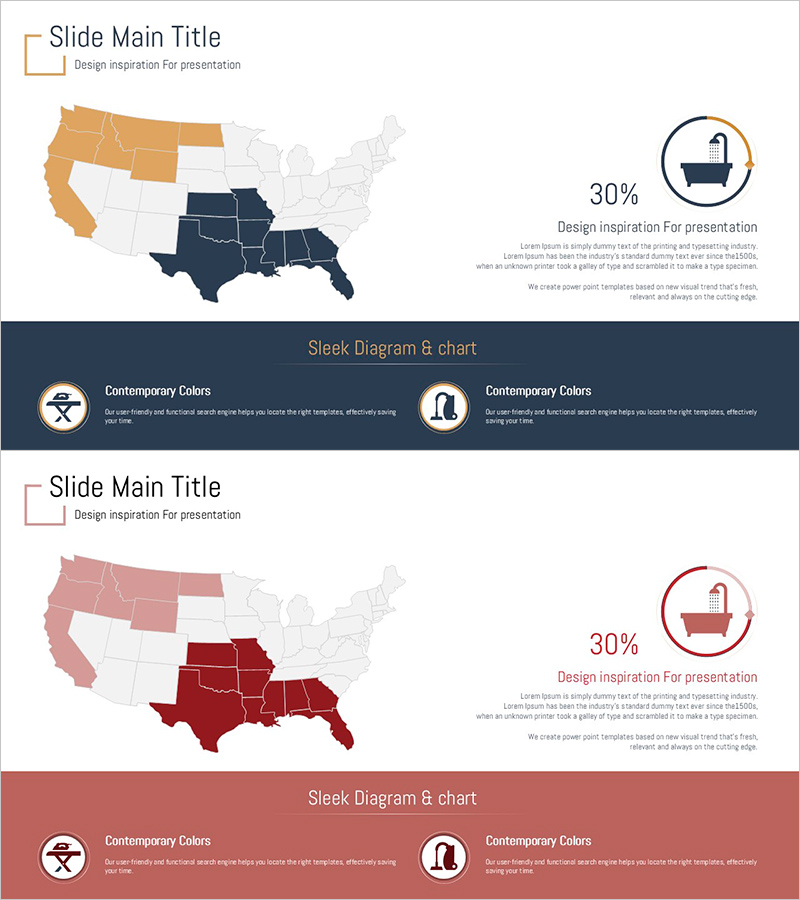
A donut chart PowerPoint slide that visualizes bathroom demand survey data with regional distribution. This 2-slide set features two color schemes: gold and navy, plus wine red and burgundy options. Each slide combines a US map showing regional demand percentages with a prominent 30% donut chart on the right side. Perfect for market analysis presentations that need to communicate both composition ratios and geographic data simultaneously. Formatted in 16:9 widescreen for modern displays, with fully editable text and numerical fields for customization.
Usage Points
-
Main Usage
Visualize market research data composition using a donut chart while displaying regional distribution through an integrated map. Ideal for bathroom industry demand surveys, consumer preference analysis, and regional market share presentations. The emphasized ratio design highlights key metrics effectively.
-
How to Use
Insert this slide into the data visualization section of your market analysis presentation. Update map colors to reflect regional demand levels and modify donut chart values and labels with your actual survey data. Add icons and text to emphasize industry-specific insights.
-
Recommended For
Market researchers, business analysts, marketing strategists, and industry research teams. Suitable for demand analysis presentations in bathroom, construction, real estate, and consumer goods sectors. Effective for investor reports and business plan documentation.
-
Slide Structure
Two-slide layout featuring a US regional map with color-coded areas, a prominent donut chart (30% emphasis), two circular icons, and text zones. Includes two distinct color themes: gold-navy and wine red-burgundy combinations.
Related Products
-

Asian Target Market Analysis – Data-Driven Visualization
#Market and Competitor Analysis #Graph #Other
-

Abstract Pattern World Map Template – Harmony of Design and Data
#Market and Competitor Analysis #Financial Plans and Performance #Graph
-

Regional Analysis Graphs – Visualizing Market Trends
#Market and Competitor Analysis #Graph #Other
-

Target Country Market Share Analysis Graph
#Market and Competitor Analysis #Graph #Other
