Asian Target Market Analysis – Data-Driven Visualization
RJ0800050_14
- Last Update 08/14/2025
- File Size 0.5MB
- # of Slides 2
- File Format PPTX
- Slide Ratio 16:9
- Color
Keywords
- #Content-Based Slides
- #Design-Based Slides
- #Market and Competitor Analysis
- #Graph
- #Other
- #Market Analysis
- #Target Market
- #Circles
- #Doughnut Chart
- #16:9
- #donut chart PowerPoint slide
- #pie chart presentation template
- #market analysis data visualization
- #proportion graph slide
- #Asia market analysis template download
About the Product
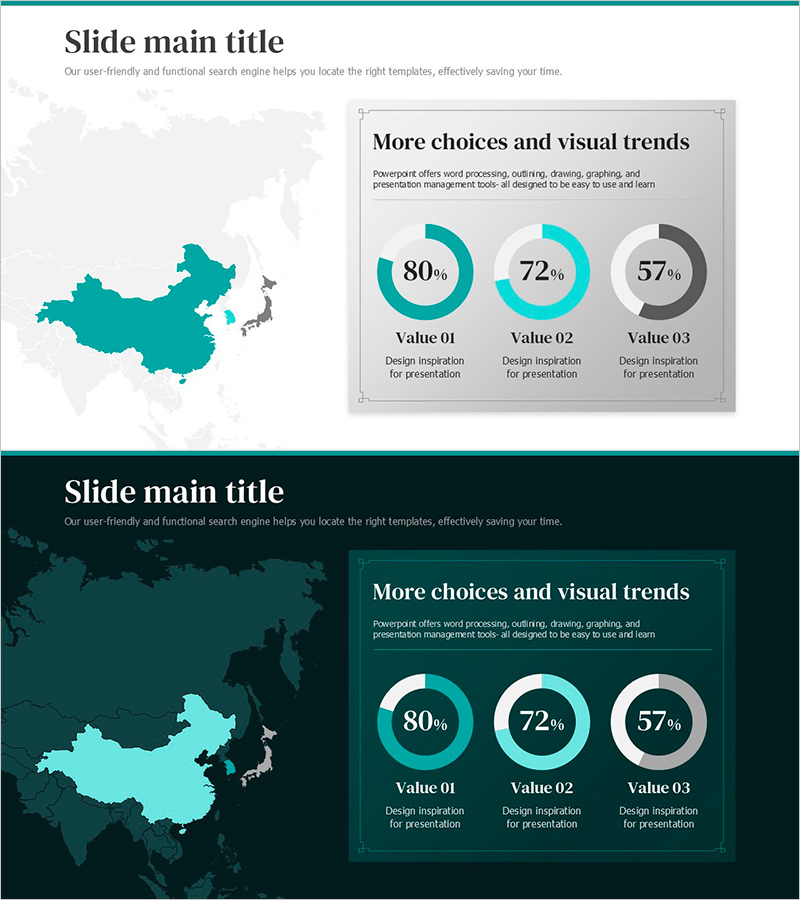
A donut chart PowerPoint slide designed for Asian target market analysis presentations. Three donut-shaped graphs display Value 01, Value 02, and Value 03 proportions with teal and gray color contrasts for clear data emphasis. The world map background with Asia highlighted provides geographic context for regional market insights. This 2-slide set includes both light and dark background layouts, allowing you to match your presentation environment and document tone. Each donut segment is color-coded for easy interpretation of market distribution and comparative analysis.
Usage Points
-
Main Usage
Visualize regional and categorical proportion data in market analysis reports, investment proposals, and business performance presentations. The donut chart's center space accommodates key metrics or titles, enhancing information delivery and audience comprehension.
-
How to Use
Double-click the donut chart values and labels to replace with your own data. Adjust colors via the Design tab to match your corporate brand. Select either the light or dark background slide based on your presentation environment and display setup.
-
Recommended For
Marketing managers, business development teams, and executives presenting market share, customer composition, and regional revenue distribution. Ideal for Asia expansion strategy presentations, global marketing plans, and quarterly performance reviews.
-
Slide Structure
2-slide set: Slide 1 features light background with world map (Asia highlighted) and 3 donut charts (80%, 72%, 57% data). Slide 2 mirrors the layout on dark background. Each donut uses distinct colors (teal, light teal, gray) with Value 01–03 labels and description text areas below.
Related Products
-

Bathroom Demand Survey Graph – Donut Chart for Market Analysis
#Market and Competitor Analysis #Graph #Other
-

Analysis of Target Market Construction Status – Data Visualization Tool
#Market and Competitor Analysis #Graph #Other
-

Target Country Market Share Analysis Graph
#Market and Competitor Analysis #Graph #Other
-

Market Analysis at a Glance with Donut Chart – Curved Theme Purple Template
#Market and Competitor Analysis #Graph #Market Analysis
