Visualizing Marketing Goals and Prospects – Opportunities for Success
RJ0900020_29
- Last Update 08/22/2025
- File Size 6.3MB
- # of Slides 2
- File Format PPTX
- Slide Ratio 16:9
- Color
Keywords
- #Content-Based Slides
- #Design-Based Slides
- #Business Strategy
- #Marketing Plan and Strategy
- #Graph
- #Other
- #Achievements
- #Marketing Objectives
- #16:9
- #marketing goals PowerPoint slide
- #marketing performance chart
- #area chart PPT design
- #marketing plan visualization
- #how to present marketing metrics in PowerPoint
About the Product
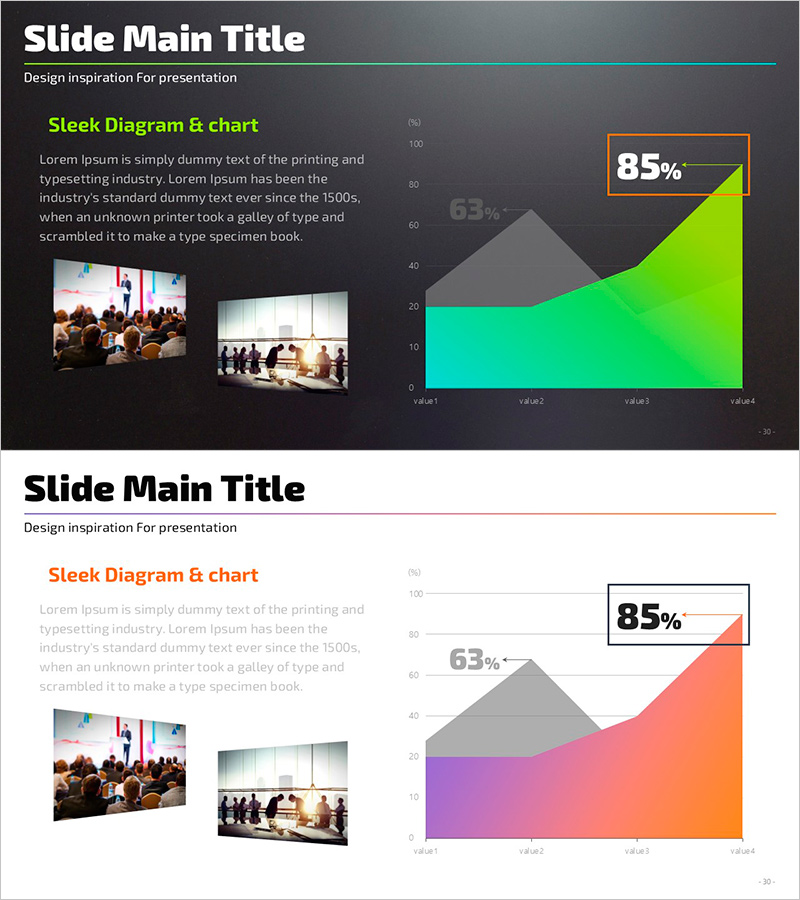
A 2-slide PowerPoint presentation for visualizing marketing objectives and performance metrics. Features a dark background with lime-green, cyan, and orange gradient area charts that highlight growth trends, paired with a left-side text section for strategy explanation. Optimized for 16:9 widescreen format, this slide deck is ready to use in business strategy presentations, marketing plan reviews, and performance reports. The flexible layout accommodates both numerical data and supporting images, making it ideal for data-driven marketing communications.
Usage Points
-
Main Usage
Visualize marketing goal achievement rates, quarterly or monthly performance trends, and channel-specific growth metrics using area charts. Enables clear communication of marketing performance to executives and team members through data-driven visual representation.
-
How to Use
Enter marketing objectives, strategies, and key messages in the left text area, then input actual performance data into the right-side chart. Use in quarterly performance reviews, marketing outcome reports, and business plan presentations to emphasize growth trajectories.
-
Recommended For
Marketing managers, business planning teams, performance report creators, and marketing presentation specialists. Particularly suited for quarterly or annual marketing performance reports, new marketing strategy proposals, and investor presentations demonstrating growth potential.
-
Slide Structure
Two-slide layout: Slide 1 features dark background with lime-cyan-orange gradient area chart, left text section, upper-right 85% emphasis box, and lower image placement area for 2 images. Slide 2 uses white background with orange-pink-gray area chart in identical structure. Includes 3 text input areas, 2 image insertion zones, and fully editable chart data fields.
Related Products
-

Current Accomplished Numerical Graph – Diagram Visualizing Achievements
#Business Strategy #Marketing Plan and Strategy #Diagram
-

Mobile Content Performance Analysis – Data-Driven Business Vision and Marketing Strategy
#Business Vision and Strategy #Marketing Plan and Strategy #Graph
-

Climbing Silhouette Bent Line Graph – Market Analysis and Performance
#Business Strategy #Market and Competitor Analysis #Graph
-

Performance and Future Outlook Graph – Harmony of Blue and Red
#Business Strategy #Market and Competitor Analysis #Graph
