Current Accomplished Numerical Graph – Diagram Visualizing Achievements
RJ0900034_18
- Last Update 08/30/2025
- File Size 0.2MB
- # of Slides 2
- File Format PPTX
- Slide Ratio 16:9
- Color
Keywords
- #Content-Based Slides
- #Design-Based Slides
- #Business Strategy
- #Marketing Plan and Strategy
- #Diagram
- #Graph
- #Other
- #Achievements
- #Marketing Objectives
- #Cluster
- #Inclusive Cluster Diagram
- #16:9
- #nested diagram PowerPoint
- #performance metrics visualization slide
- #achievement rate chart
- #concentric circle diagram
- #business performance presentation template
About the Product
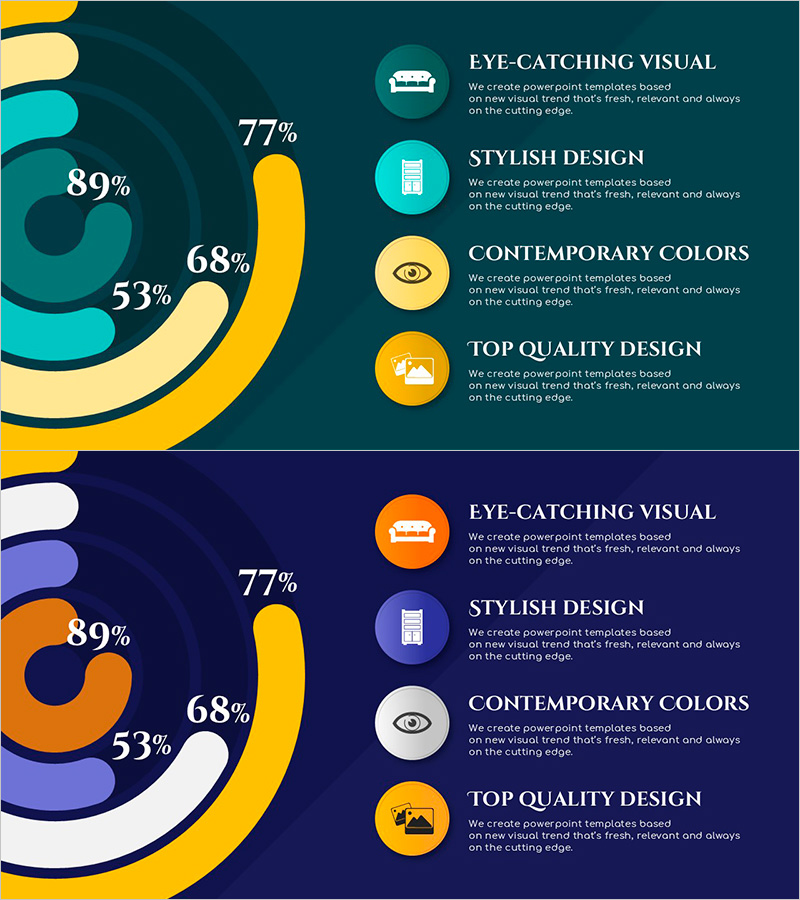
A nested concentric diagram PowerPoint slide that visualizes business performance metrics with clarity and impact. The design displays four achievement percentages (89%, 77%, 68%, 53%) in a layered circular structure, enabling stakeholders to assess progress against targets at a glance. Built on a dark teal background with yellow and cyan accent colors across 2 slides, this template is ready for marketing performance reports, business achievement presentations, and strategic planning sessions. The 16:9 widescreen PPTX format ensures compatibility with all presentation software and full editability.
Usage Points
-
Main Usage
Visualizes quarterly or annual business performance through layered numerical metrics, enabling simultaneous comparison of overall targets against stage-by-stage progress. The nested structure is ideal for executive briefings, investor presentations, and marketing performance reviews where hierarchical data representation strengthens decision-making.
-
How to Use
Replace the sample percentages (89%, 77%, 68%, 53%) with your actual achievement rates. The dark teal background conveys stability and trust, while yellow and cyan accents highlight key metrics. The 2-slide layout supports both summary and detailed analysis presentations, allowing flexible narrative flow.
-
Recommended For
Marketing teams presenting campaign performance, sales departments reporting quarterly targets, executives delivering business achievement briefings, investor relations teams preparing pitch materials, and strategy teams building data-driven presentations. Ideal for organizations prioritizing metrics-based communication.
-
Slide Structure
Slide 1: Dark teal background with 4-layer concentric circles displaying 89%, 77%, 68%, 53% metrics. Right side features 4 circular icons (sofa, building, eye, image) with accompanying text descriptions. Slide 2: Identical diagram structure rendered on dark navy background, providing color variation option for visual diversity.
Related Products
-

Contrast Highlight Customer Analysis Chart - Strategic Analysis for Competitors
#Business Strategy #Market and Competitor Analysis #Diagram
-

Visualizing Marketing Goals and Prospects – Opportunities for Success
#Business Strategy #Marketing Plan and Strategy #Graph
-

Product Sales Status Chart – Effective Data Visualization
#Business Strategy #Market and Competitor Analysis #Diagram
-

Business Plan Template with Area Chart for Market Analysis
#Market and Competitor Analysis #Marketing Plan and Strategy #Graph
