Target Country Analysis Graph – Understanding Global Markets
RJ0300062_7
- Last Update 05/05/2025
- File Size 0.6MB
- # of Slides 2
- File Format PPTX
- Slide Ratio 16:9
- Color
Keywords
About the Product
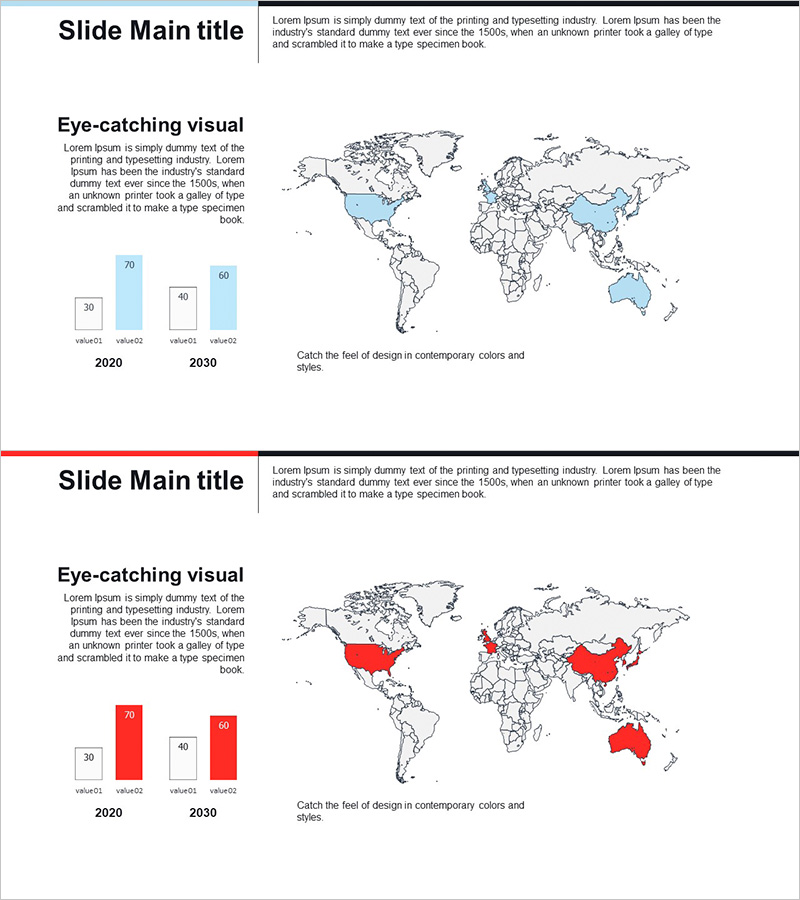
A world map-based PowerPoint slide designed to visualize global market expansion strategies. This 2-slide set combines an interactive world map with highlighted target countries and horizontal bar charts comparing 2020 and 2030 data on the left side. Two color variants—blue and red—are included to match your presentation theme and tone. Ideal for international business presentations, market entry reports, investor pitches, and strategic planning sessions where regional growth trends and target markets need to be communicated clearly and intuitively.
Usage Points
-
Main Usage
Visualize target countries on a world map and demonstrate market growth potential through year-over-year data comparison. Perfect for international business pitches, overseas expansion reports, and investor presentations where regional opportunities and strategic priorities must be clearly communicated.
-
How to Use
Input actual sales figures, market size, or growth rates into the horizontal bar chart on the left side, then highlight corresponding countries on the world map to show regional performance at a glance. Display 2020 and 2030 data side-by-side to effectively illustrate market evolution and future projections.
-
Recommended For
International marketing managers, overseas business development teams, investor relations (IR) professionals, executive report writers, and C-suite executives planning global expansion. Particularly valuable for presentations requiring multi-country market analysis and regional performance comparison.
-
Slide Structure
Two-slide layout featuring a world map with country highlighting capability paired with a horizontal bar chart (comparing 2020 and 2030 data across 4 metrics) positioned on the left. Blue variant conveys professional business tone; red variant emphasizes performance results and strategic achievements.
Related Products
-

Fantastic Wide PowerPoint Map & Bar Chart
#Company Introduction #Market and Competitor Analysis #Graph
-

Target Market Analysis World Map & Bar Graph
#Company Introduction #Market and Competitor Analysis #Graph
-

Global Market Analysis Map – Importance of Market Connectivity
#Company Introduction #Market and Competitor Analysis #Graph
-

Country-by-Country Bar Chart Analysis – Market Trend Insights
#Company Introduction #Market and Competitor Analysis #Graph
