Competitor Comparison Analysis Table – Understanding the Market and Competition
RM0100001_12
- Last Update 01/24/2025
- File Size 2MB
- # of Slides 2
- File Format PPTX
- Slide Ratio 16:9
- Color
Keywords
- #Content-Based Slides
- #Design-Based Slides
- #Market and Competitor Analysis
- #Financial Plans and Performance
- #Diagram
- #Competitor Analysis
- #Capital Requirements
- #Table
- #16:9
- #competitor comparison analysis table
- #competitor comparison PowerPoint slide
- #market analysis table PPT
- #competitive analysis matrix
- #comparison table slide
About the Product
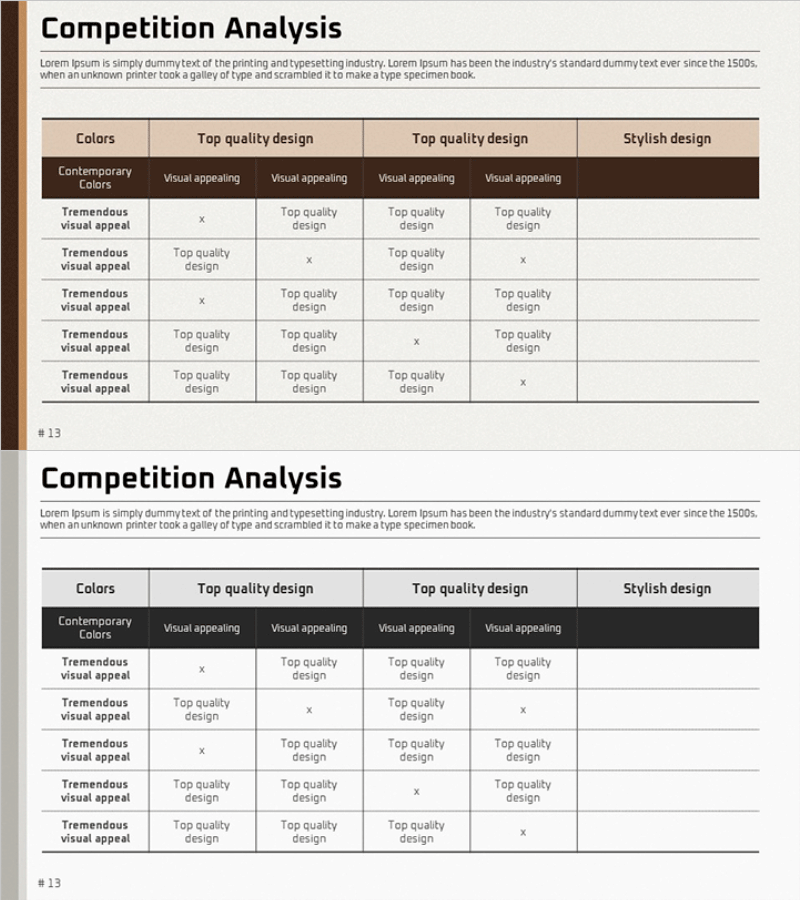
A 2-slide PowerPoint presentation for competitive analysis featuring a structured comparison matrix. The first slide displays a 5-row by 4-column table with a beige background and brown header, comparing three competitors across key dimensions: colors, top quality design, visual appeal, and stylish design. Each row represents an evaluation criterion, and each column represents a competitor, enabling quick visual comparison of competitive strengths. The second slide provides an editable template with the same structure for custom analysis. Ideal for market analysis, investor presentations, and strategic planning sessions where competitive positioning needs to be communicated clearly.
Usage Points
-
Main Usage
Structurally compare competitor strategies across color schemes, design quality, visual appeal, and trend adoption using a data-driven matrix format. Supports investors, executives, and marketing teams in understanding competitive landscape and making informed strategic decisions.
-
How to Use
Enter comparison criteria in each row (colors, design quality, visual appeal, trend elements) and competitor names in column headers. Fill cells with evaluation details. Use the first slide as a reference example and the second slide as an editable template for your competitive analysis presentation.
-
Recommended For
Business strategy development, market entry planning, investor pitch decks, executive briefings, and marketing strategy documents. Essential for competitive benchmarking, differentiation strategy formulation, and market positioning discussions.
-
Slide Structure
2-slide set. Slide 1: Title + 5-row 4-column matrix table with brown header, beige background, row labels, and 3 competitor columns. Slide 2: Identical editable template structure. All cells are formatted as text input areas for easy customization.
Related Products
-

Real Estate Business Fund Management Plan: Visualizing Financial Performance
#Financial Plans and Performance #Diagram #Capital Requirements
-

Project Funding Plan – Easy to Create Financial Planning Slide
#Financial Plans and Performance #Diagram #Capital Requirements
-

Construction Project Fund Management Plan – Designing Financial Plans and Performance
#Financial Plans and Performance #Diagram #Capital Requirements
-

Corporate Investment and Financing Profit Statement – Efficient Funding Plan
#Financial Plans and Performance #Diagram #Capital Requirements
