Blackboard and Comparison Table Chart – Optimized for Market and Competitor Analysis
RJ0500004_11
- Last Update 06/08/2025
- File Size 2.1MB
- # of Slides 2
- File Format PPTX
- Slide Ratio 16:9
- Color
Keywords
About the Product
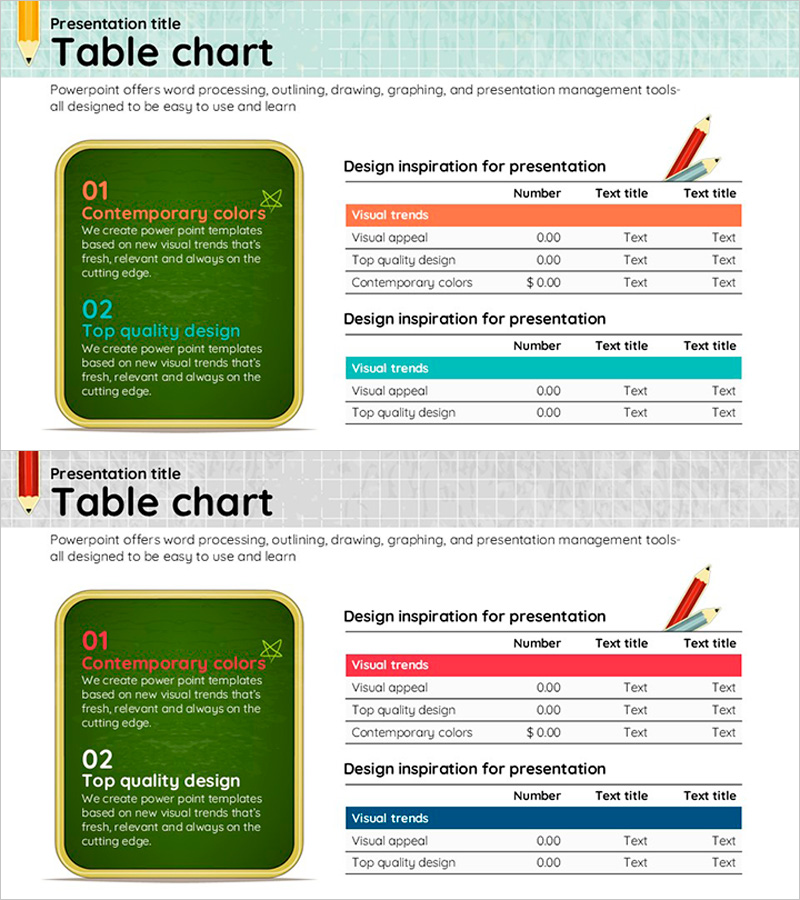
A PowerPoint slide deck optimized for market analysis and competitor comparison featuring a blackboard-style background with two distinct table layouts. The tables use a 3-column structure (Item, Description, Value) with 3-4 data rows, employing orange and teal header colors for visual distinction. Each layout provides clear data organization for presenting product feature comparisons, market positioning, and competitive benchmarking. The dark background with colored headers creates a professional analytical presentation suitable for business reports, strategy meetings, and market research presentations.
Usage Points
-
Main Usage
Present quantitative data comparisons including market analysis, competitor positioning, product feature differentiation, and performance metrics in a structured table format. The blackboard aesthetic reinforces analytical credibility while color-coded headers provide visual information hierarchy.
-
How to Use
Enter category names in the colored header rows (orange or teal), then populate data rows with comparison items and corresponding values. During presentation, reference the left-side text box for analysis context before revealing specific metrics in the table.
-
Recommended For
Marketing professionals presenting market research, sales teams conducting competitive analysis, strategy planners demonstrating product positioning, finance teams comparing performance metrics, and consultants preparing benchmarking reports.
-
Slide Structure
Slide 1: Left-side blackboard-style text box (2 items) paired with right-side 3-column table (orange header, 4 data rows). Slide 2: Identical layout with teal header color. Both slides optimized for 16:9 aspect ratio.
Related Products
-

Market Trend Analysis Graph – Visualizing Market Status
#Market and Competitor Analysis #Diagram #Graph
-

Comparative Analysis Bar Graph & Table – Optimized for Market and Competitor Analysis
#Market and Competitor Analysis #Diagram #Graph
-

Graph Chart for Analysis Comparison – Market and Competitor Analysis
#Market and Competitor Analysis #Diagram #Graph
-

Sales and Profit Analysis Graph – Market Trends and Forecast
#Market and Competitor Analysis #Diagram #Graph
