Visualizing Sales Performance Trends with a Bar Chart – Market Competitor Analysis
RJ0900020_10
- Last Update 08/21/2025
- File Size 7.2MB
- # of Slides 2
- File Format PPTX
- Slide Ratio 16:9
- Color
Keywords
- #Content-Based Slides
- #Design-Based Slides
- #Market and Competitor Analysis
- #Graph
- #Industry Trends
- #Horizontal Bar
- #Segmented Horizontal Bar
- #16:9
- #horizontal bar chart PowerPoint
- #sales performance chart template
- #data comparison slide
- #market analysis graph
- #bar graph presentation
- #data visualization PowerPoint slide
About the Product
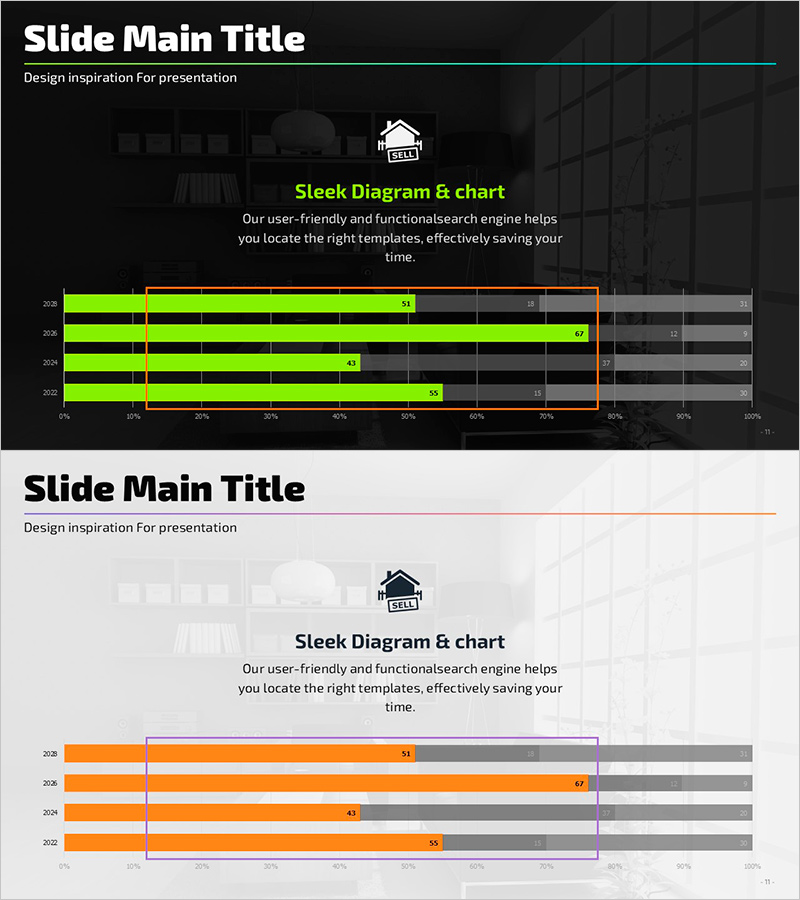
A horizontal bar chart PowerPoint slide that visualizes sales performance trends and market analysis with clarity and precision. The slide features a dual-series design with lime green primary bars and gray secondary bars, enabling direct comparison of four data items. An orange accent box highlights a specific range to emphasize key insights in your presentation. This 16:9 widescreen slide template comes in a 2-slide set, ready for immediate use in quarterly sales reports, competitive benchmarking, market analysis presentations, and business performance reviews.
Usage Points
-
Main Usage
Display quantitative data across four items using horizontal bars to emphasize relative magnitude comparison. The orange accent box highlights a critical range—such as target achievement or competitive advantage zone—to draw audience focus to key performance indicators.
-
How to Use
Insert this slide into quarterly sales reports, competitive analysis sections, or market performance presentations. Assign the lime green series to your company's metrics and the gray series to competitor or target benchmarks for clear visual contrast. Pre-formatted data labels ensure accurate numerical communication.
-
Recommended For
Sales and marketing professionals presenting quarterly results, executives delivering market analysis to stakeholders, and business development teams preparing competitive proposals. Ideal for investor pitch decks, business plans, and market research reports where performance comparison is critical.
-
Slide Structure
Two-slide template featuring horizontal bar charts with 4 data items per slide. Each slide displays dual-series bars: lime green primary series (approximately 50–70% range) and gray secondary series (approximately 10–30% range). An orange border box marks a specific range for emphasis. Standard horizontal axis (0–100% scale) and vertical axis (item labels) layout with data value labels integrated.
Related Products
-

Memorable Travel Destinations Survey Slide – Market and Competitive Analysis
#Market and Competitor Analysis #Graph #Industry Trends
-

Animal Natural Environment Improvement Rate Future Outlook Horizontal Bar Chart
#Market and Competitor Analysis #Graph #Industry Trends
-

World Travel Template Horizontal Bar Segment Chart
#Market and Competitor Analysis #Graph #Industry Trends
-

Visualizing Camping Business Market Share with Bar Chart
#Market and Competitor Analysis #Graph #Industry Trends
