Horizontal Bar Graph for Demand Analysis of Photographic Equipment - Market Trends
RJ0600089_8
- Last Update 07/14/2025
- File Size 0.6MB
- # of Slides 2
- File Format PPTX
- Slide Ratio 16:9
- Color
Keywords
About the Product
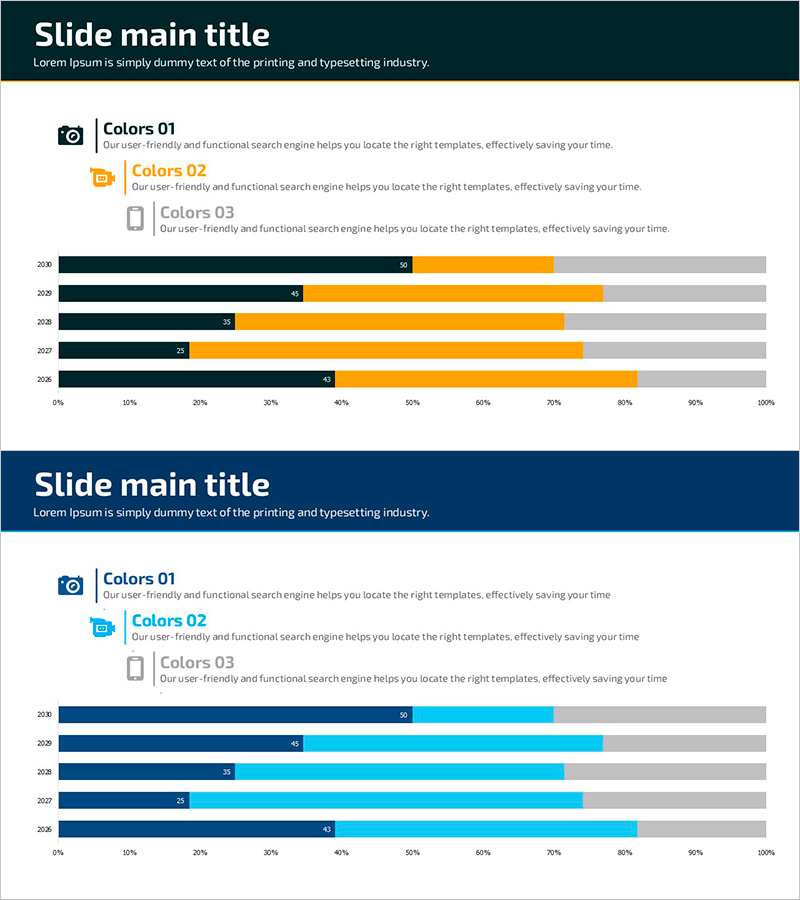
A horizontal bar graph PowerPoint slide designed for analyzing photographic equipment market demand. This 2-slide presentation features a dark navy background with black and orange bar segments, comparing market trends across five years from 2026 to 2030. Each year's numerical data is clearly displayed with a stacked bar format, and the gray area on the right allows for additional information input. Perfect for market analysis presentations, sales reports, and demand forecasting slides that require immediate deployment.
Usage Points
-
Main Usage
Visualizes year-over-year market demand changes using horizontal bar graphs to clearly communicate market trends. Effectively displays quantitative data such as sales volume, market size, and demand forecasts for the photographic equipment industry. Transforms numerical data into intuitive visual comparisons that strengthen decision-making foundations.
-
How to Use
Insert into the market analysis section of marketing plans, business reports, and investor presentations. Replace bar values with actual data and update legend text with relevant product names or categories. Customize colors to align with brand guidelines and corporate identity standards.
-
Recommended For
Marketing managers, planning teams, sales executives, and financial analysts presenting market conditions. Ideal for electronics, camera, and photographic equipment companies during quarterly and annual performance reports, new product launch strategy meetings, and investor relations events.
-
Slide Structure
Consists of 2 slides with dark navy header sections and white content areas. Features a horizontal stacked bar chart with 0-100% scale on the x-axis, representing 5 years of data (2026-2030). Uses black as the baseline value and orange as the accent value to compare two data series. The gray area on the right provides space for additional text annotations or supplementary information.
Related Products
-

World Travel Template Horizontal Bar Segment Chart
#Market and Competitor Analysis #Graph #Industry Trends
-

Analyzing Flower Horizontal Segmentation Charts – Understanding Market Trends
#Market and Competitor Analysis #Graph #Industry Trends
-

Stacked Bar Graph for Growing Market Trends – Business Strategy
#Business Strategy #Market and Competitor Analysis #Graph
-

Memorable Travel Destinations Survey Slide – Market and Competitive Analysis
#Market and Competitor Analysis #Graph #Industry Trends
