Market Share Status Visualized with a Donut Chart
RM0100001_11
- Last Update 01/24/2025
- File Size 2.7MB
- # of Slides 2
- File Format PPTX
- Slide Ratio 16:9
- Color
Keywords
- #Content-Based Slides
- #Design-Based Slides
- #Product/Service Introduction
- #Market and Competitor Analysis
- #Graph
- #Development Status
- #Market Share
- #Circles
- #Doughnut Chart
- #16:9
- #donut chart PowerPoint
- #pie chart slide template
- #market share visualization
- #4-segment donut chart
- #ratio comparison slide
- #data visualization PowerPoint template
About the Product
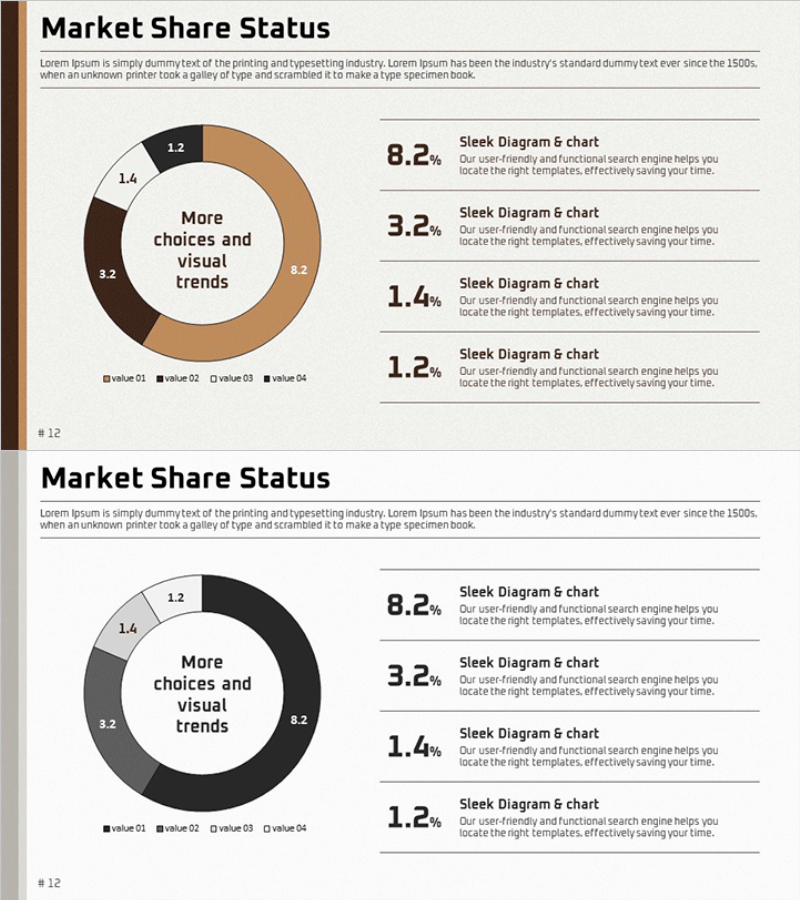
A 4-segment donut chart PowerPoint slide designed to visualize market share status and data distribution. The slide features a warm color palette with beige, brown, and black tones, with a central text area for emphasizing key messages. Each segment displays numerical values and legend labels for effective data comparison and analysis. The 2-slide set includes two color variations (warm beige tone and monochrome tone) for immediate use in presentations, reports, and business proposals. Available in 16:9 widescreen PPTX format, fully editable in all PowerPoint versions.
Usage Points
-
Main Usage
Effectively communicates proportional relationships such as market share, sales distribution, customer composition, and budget allocation. The central text area highlights key messages and draws audience attention to critical insights.
-
How to Use
Double-click each segment to edit numerical values and update legend labels with your category names. Adjust colors using the theme color palette, and freely modify the central text area to match your presentation content.
-
Recommended For
Ideal for executive presentations, quarterly and annual performance reviews, market analysis reports, investor pitch decks, and business plan market overview sections. Suitable for marketing teams, sales departments, and management presentations.
-
Slide Structure
Donut-shaped pie chart with 4 segments displaying percentages (8.2%, 3.2%, 1.4%, 1.2%) and legend labels (value 01–04). Central text input area allows emphasis of key messages. The 2-slide set provides warm beige and monochrome color variations for flexible design application.
Related Products
-

Graph of Transportation Service Usage Status – Market and Competitor Analysis
#Product/Service Introduction #Market and Competitor Analysis #Graph
-

Doughnut Chart for Online Shopping Mall Market Analysis
#Product/Service Introduction #Market and Competitor Analysis #Graph
-

Development Status Analysis Graph – Visualizing Market Share
#Product/Service Introduction #Market and Competitor Analysis #Graph
-

Holiday vs Break Time Analysis Doughnut Chart
#Product/Service Introduction #Market and Competitor Analysis #Graph
