Visualizing Future Outlook and Expected Effects – Harmony of Green and Orange
RJ0400024_10
- Last Update 05/24/2025
- File Size 2.3MB
- # of Slides 2
- File Format PPTX
- Slide Ratio 16:9
- Color
Keywords
- #Content-Based Slides
- #Design-Based Slides
- #Business Strategy
- #Market and Competitor Analysis
- #Graph
- #Financial Outlook & Expected Impact
- #Future Outlook
- #Line
- #Line Chart
- #16:9
- #line chart PowerPoint
- #trend analysis slide template
- #dual-series data visualization
- #10-year comparison chart
- #performance metrics graph
About the Product
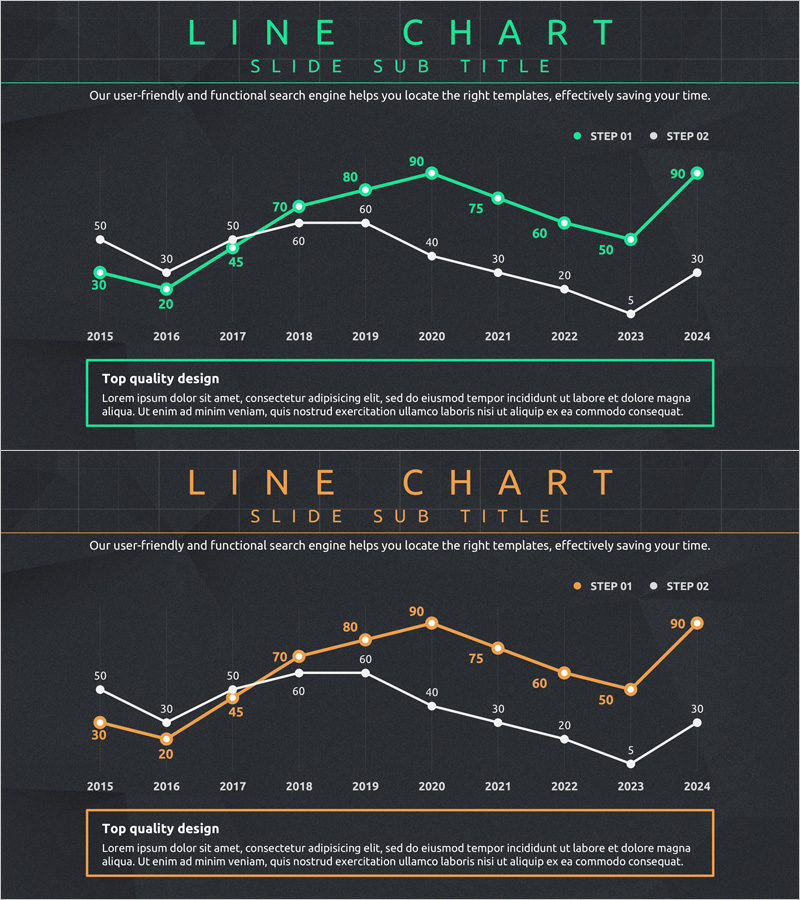
A dual-series line chart PowerPoint slide visualizing 10 years of data trends from 2015 to 2024. Two trend lines in green and orange distinguish performance metrics over time, with precise numerical values displayed at each data point for accurate comparison. The dark background grid structure enhances readability and professional appearance. This presentation slide is ready to use for business forecasts, expected outcomes, performance comparisons, and strategic analysis in corporate presentations.
Usage Points
-
Main Usage
Optimized for comparing and analyzing two performance metrics simultaneously over time. Ideal for visualizing future outlooks, expected effects, performance comparisons, growth rate analysis, and other business data in presentations.
-
How to Use
Replace the displayed numbers and years with your own data for immediate use. Use the green series for positive indicators and orange for comparison targets, or adjust colors as needed. During presentations, emphasize intersection points or peak/low values to highlight key messages.
-
Recommended For
Suitable for executive reports, business performance presentations, investor briefings, marketing strategy meetings, and quarterly or annual performance analysis. Finance teams, marketing departments, business planning teams, and sales divisions benefit from this data-driven visualization tool.
-
Slide Structure
Composed of two trend lines with X-axis showing 10 years (2015–2024) and Y-axis displaying numerical scale (0–90). Each data point includes precise values, with a legend (STEP 01·STEP 02) distinguishing the two series. Dark gray background grid combined with green, orange, and white colors provides clear visual contrast.
Related Products
-

IT Service Future Outlook and Expected Effects Graph – Analyzing Impact
#Business Strategy #Market and Competitor Analysis #Graph
-

Business Strategy Analysis with Line Chart
#Business Strategy #Market and Competitor Analysis #Diagram
-

Mint Green Curved Line Trend - Revenue Forecast and Expectations
#Business Strategy #Market and Competitor Analysis #Graph
-

Future Outlook and Expected Effects Graph – Harmony of Blue and Orange
#Business Strategy #Market and Competitor Analysis #Graph
