Line Charts in Urban Background – Business Strategy and Market Analysis
RJ0900010_11
- Last Update 08/18/2025
- File Size 34MB
- # of Slides 2
- File Format PPTX
- Slide Ratio 16:9
- Color
Keywords
- #Content-Based Slides
- #Design-Based Slides
- #Business Strategy
- #Market and Competitor Analysis
- #Graph
- #Financial Outlook & Expected Impact
- #Future Outlook
- #Line
- #Line Chart
- #16:9
- #line chart PowerPoint
- #dual-series graph slide
- #trend analysis presentation
- #business data visualization
- #how to create line chart in PowerPoint
- #market analysis slide template
About the Product
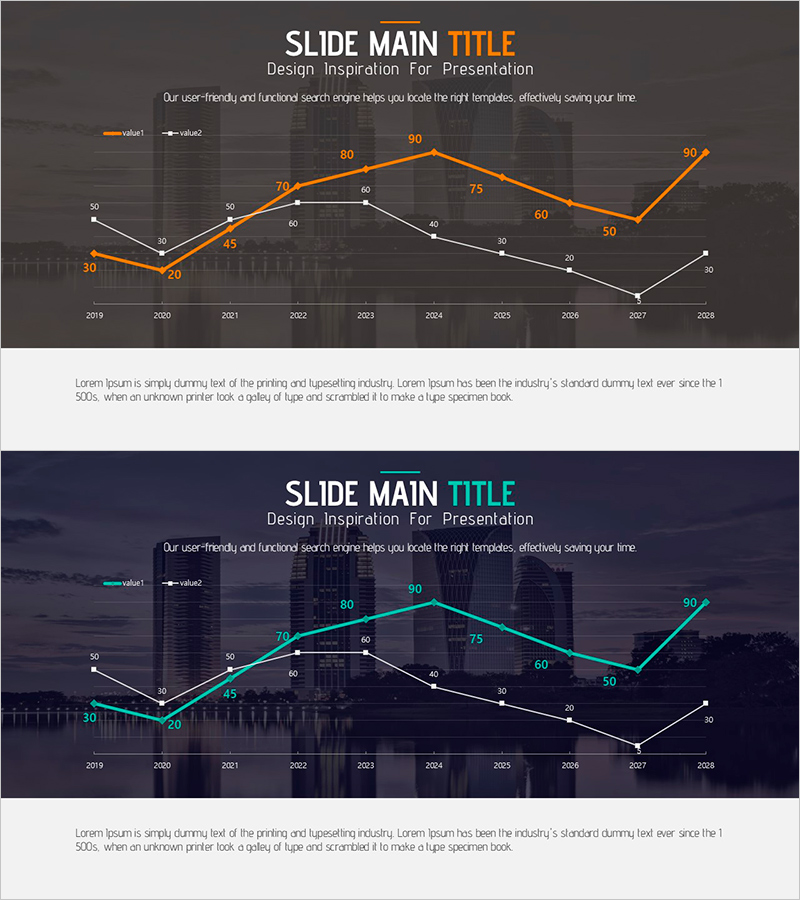
A PowerPoint slide featuring a dual-series line chart with orange and gray data lines against an urban skyline background. The chart visualizes 10-year data trends from 2019 to 2028, with each data point labeled with numerical values. Ideal for business strategy presentations, market analysis reports, sales performance reviews, and growth rate comparisons. The slide set includes 2 slides in 16:9 widescreen format, fully editable in PPTX format for immediate customization.
Usage Points
-
Main Usage
Compares two data series simultaneously to show contrasting trends over time. Perfect for comparing forecast vs. actual results, company performance vs. competitors, revenue vs. volume, or any paired metrics requiring side-by-side analysis in executive presentations.
-
How to Use
Replace the sample data points and numerical labels with your actual figures. Customize the color scheme by changing the orange and gray lines to match your corporate branding. Edit the legend, axis labels, and title to reflect your specific data context and presentation goals.
-
Recommended For
Executive dashboards, quarterly earnings reports, marketing performance reviews, financial forecasts, strategic planning sessions, and investor presentations. Recommended for CFOs, marketing directors, business analysts, management consultants, and data-driven decision makers.
-
Slide Structure
Two data series (orange and gray lines) with 10 data points spanning 2019–2028. Each point includes numerical value labels. Includes legend, X-axis (years), and Y-axis (values). Urban skyline background reinforces professional business context.
Related Products
-

Construction Industry Future Forecast Graphs and Messages
#Business Strategy #Market and Competitor Analysis #Graph
-

Future Outlook and Expected Effects Visualization – Graph Representing Business Strategic Plans
#Business Strategy #Market and Competitor Analysis #Graph
-

IT Service Future Outlook and Expected Effects Graph – Analyzing Impact
#Business Strategy #Market and Competitor Analysis #Graph
-

Mint Green Curved Line Trend - Revenue Forecast and Expectations
#Business Strategy #Market and Competitor Analysis #Graph
