Market Trends Graphs and Forecast Messages - Essential for Business Strategy
RJ0900019_19
- Last Update 08/21/2025
- File Size 0.7MB
- # of Slides 2
- File Format PPTX
- Slide Ratio 16:9
- Color
Keywords
- #Content-Based Slides
- #Design-Based Slides
- #Business Strategy
- #Market and Competitor Analysis
- #Graph
- #Financial Outlook & Expected Impact
- #Industry Trends
- #Horizontal Bar
- #Segmented Horizontal Bar
- #16:9
- #market trend chart
- #horizontal bar chart PowerPoint
- #business strategy presentation
- #data comparison slide
- #market analysis template
About the Product
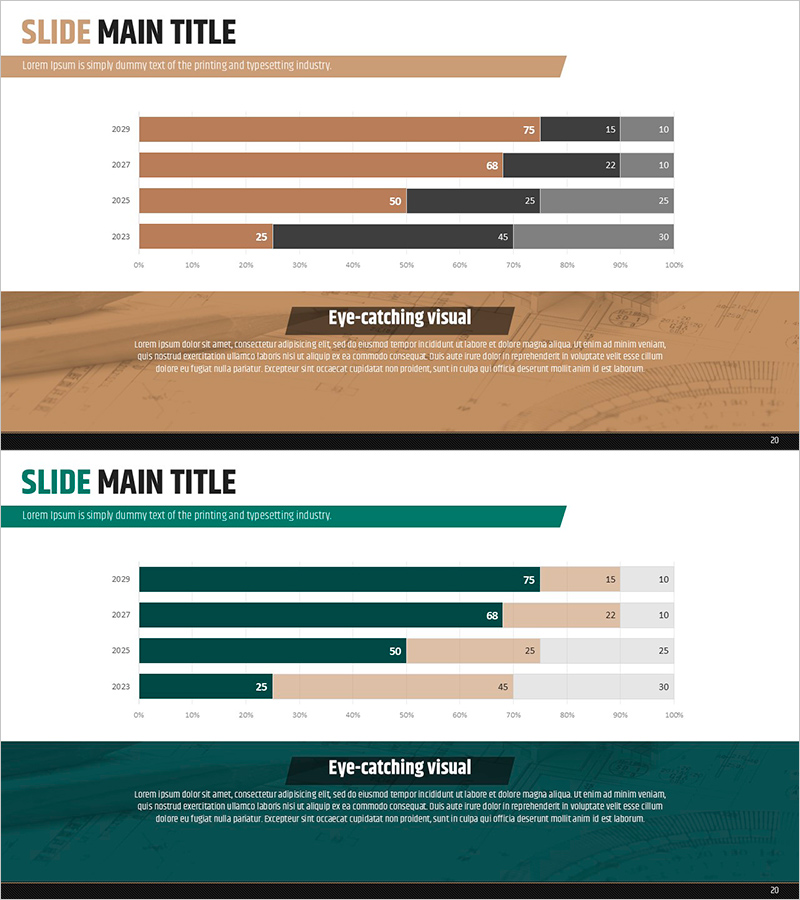
A horizontal bar chart PowerPoint slide for visualizing market trends across four years of data. This presentation template displays 2029, 2027, 2025, and 2023 data segmented into three series using a professional color palette of tan, black, and gray. Clear numerical labels on each bar enable immediate use in business presentations, making it ideal for presenting market conditions during strategy development phases. The 16:9 widescreen format with two-slide layout allows you to effectively structure your market analysis section.
Usage Points
-
Main Usage
Compare year-over-year market trend data across three series to establish evidence-based business strategy. The horizontal bar format enables intuitive understanding of numerical differences between data points, serving as critical material for market condition analysis and future outlook planning.
-
How to Use
Insert into business plans, investment pitch decks, and market analysis reports within the market overview section to present data-driven strategic foundations. Edit each bar with actual data to customize for your presentation context, making it highly effective for executive briefings and stakeholder persuasion.
-
Recommended For
Marketing managers, business planners, management analysts, and investment professionals requiring data-driven decision-making. Particularly valuable for market research result sharing, competitive analysis presentations, and business performance evaluation reports.
-
Slide Structure
Two-slide layout featuring tan header bars with four-year horizontal bar charts. First slide uses neutral background; second slide features dark teal background. Each bar is segmented into three series (tan, black, gray) with clearly displayed numerical labels for easy data reading.
Related Products
-

100% Stacked Column Chart Slide – Performance and Market Trends
#Business Strategy #Market and Competitor Analysis #Graph
-

Horizontal Bar Chart for Annual Coffee Consumption – Business Strategy
#Business Strategy #Market and Competitor Analysis #Graph
-

3D Horizontal Segmentation Graph – Market Trend Analysis
#Market and Competitor Analysis #Graph #Industry Trends
-

Blue Green Stacked Bar Chart – Market Trend Analysis
#Business Introduction #Market and Competitor Analysis #Graph
