Architectural Illustration Template Segmentation Graph – Effective for Market Analysis
RJ0900001_22
- Last Update 08/15/2025
- File Size 0.2MB
- # of Slides 2
- File Format PPTX
- Slide Ratio 16:9
- Color
Keywords
- #Content-Based Slides
- #Design-Based Slides
- #Market and Competitor Analysis
- #Graph
- #Industry Trends
- #Horizontal Bar
- #Segmented Horizontal Bar
- #16:9
- #horizontal bar chart PowerPoint
- #market analysis presentation slide
- #construction industry graph
- #competitive analysis chart
- #how to create bar chart in PowerPoint
About the Product
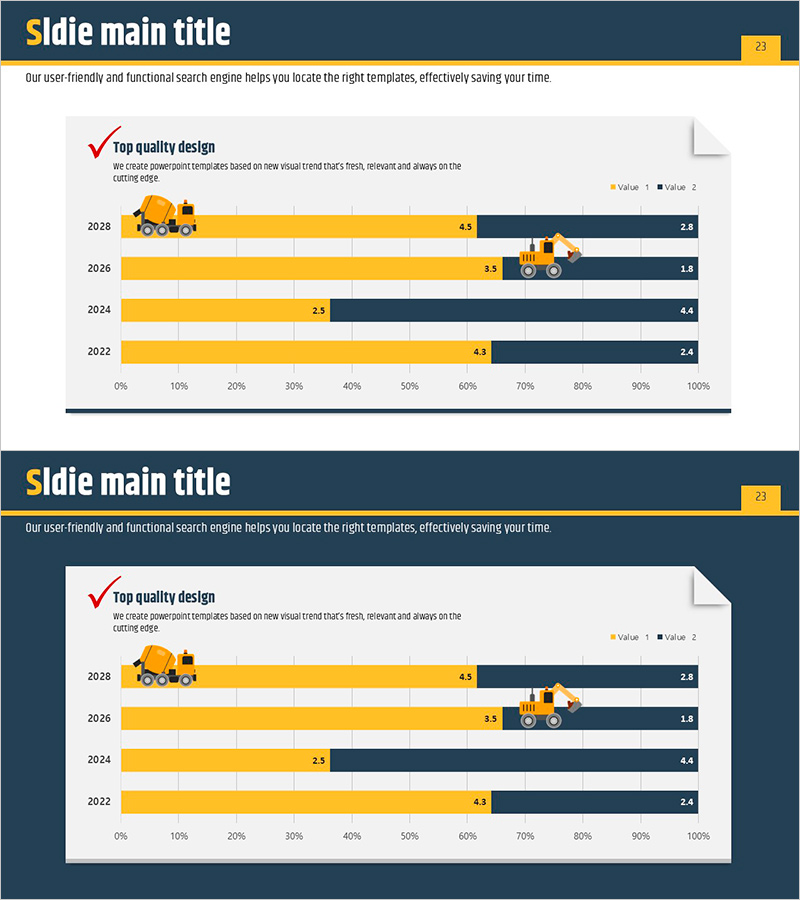
A horizontal bar chart PowerPoint slide designed for construction and real estate market analysis. The design features a two-tone color scheme of orange and dark blue, with construction equipment illustrations that visually emphasize industry characteristics. The 2-slide set effectively communicates various numerical data such as market size, competitive analysis, and market share comparisons. Optimized for modern presentation environments in 16:9 widescreen PPTX format, all elements are fully editable and ready to customize for your specific data.
Usage Points
-
Main Usage
Visualizes numerical data such as market size, market share, and competitor comparisons in the construction, real estate, and building industries using a horizontal bar format. The contrast between orange accent bars and dark blue background highlights key figures, while construction equipment illustrations provide intuitive industry context.
-
How to Use
Use in business reports, investor presentations, market analysis briefings, and executive updates to explain competitive landscape and market trends. Edit each bar's values with your own data, customize titles and legends to match your presentation context, and adjust colors as needed.
-
Recommended For
Ideal for construction companies, real estate developers, and architectural firms presenting to executives, investors, and stakeholders. Also suitable for construction consulting firms, real estate agencies, and architecture educational institutions explaining industry conditions and market positioning.
-
Slide Structure
2-slide set with the first slide featuring a 5-item horizontal bar chart (orange Value 1 bars, dark blue Value 2 bars) alongside construction equipment illustrations. The second slide provides an alternative layout with the same structure. 16:9 widescreen format with all elements as fully editable shapes.
Related Products
-

Analyzing Flower Horizontal Segmentation Charts – Understanding Market Trends
#Market and Competitor Analysis #Graph #Industry Trends
-

Animal Natural Environment Improvement Rate Future Outlook Horizontal Bar Chart
#Market and Competitor Analysis #Graph #Industry Trends
-

Yellow Green Detailed Analysis Chart - Visualizing Market Trends
#Business Strategy #Market and Competitor Analysis #Diagram
-

World Travel Template Horizontal Bar Segment Chart
#Market and Competitor Analysis #Graph #Industry Trends
