Pie Chart for Decimal Ratio Analysis – Market Share Status
RB0100024_5
- Last Update 03/03/2025
- File Size 0.6MB
- # of Slides 2
- File Format PPTX
- Slide Ratio 4:3
- Color
Keywords
- #Content-Based Slides
- #Design-Based Slides
- #Market and Competitor Analysis
- #Graph
- #Market Status
- #Market Share
- #Circles
- #Doughnut Chart
- #4:3
- #donut chart PowerPoint slide
- #pie chart template download
- #market share analysis PPT
- #ratio visualization slide
- #4-series donut diagram
- #data visualization PowerPoint template
About the Product
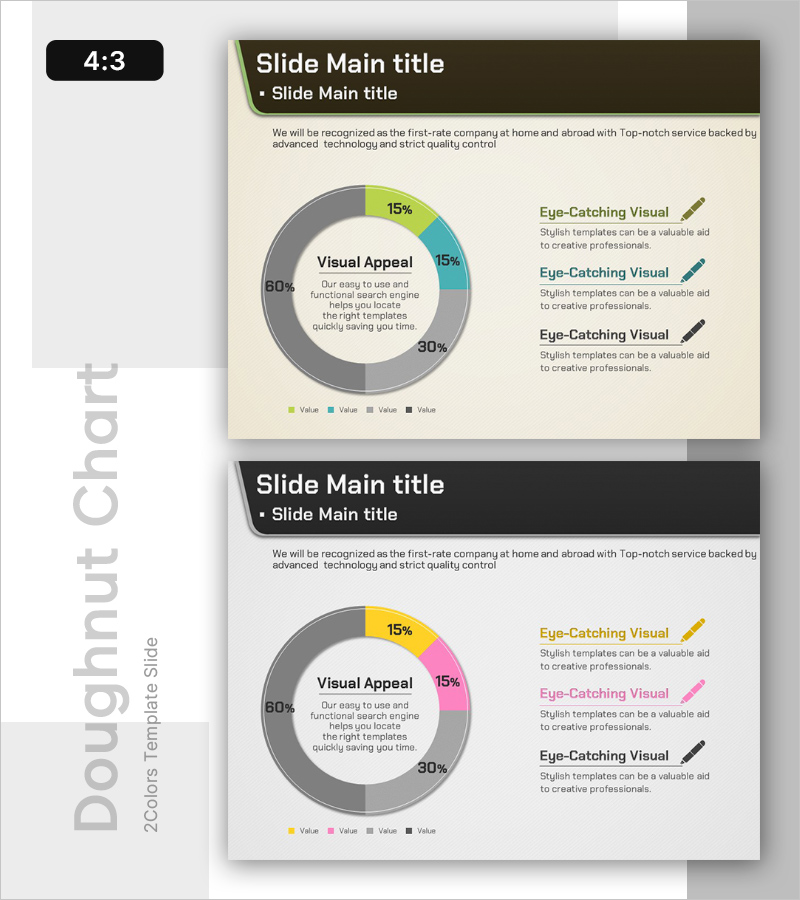
A donut chart PowerPoint slide optimized for market share and decimal ratio analysis. The center space allows you to emphasize key metrics at a glance, making it ideal for executive presentations. Four data series are distinguished using lime green, teal, gray, and black colors for visual clarity. Three text boxes on the right side enable detailed descriptions for each segment. The 2-slide set accommodates various ratio analysis scenarios and maintains 4:3 aspect ratio compatibility across all presentation environments.
Usage Points
-
Main Usage
Visualizes proportional relationships such as market share, sales ratio, customer composition, and budget allocation. The donut center space highlights critical figures or percentages, while four color-coded series clearly distinguish each segment for audience comprehension.
-
How to Use
Use in sales and marketing reports to show competitive market positioning, or in financial presentations to analyze cost structure. Input numerical values for automatic ratio calculation, then add explanatory text in the right-side boxes to enhance audience understanding and engagement.
-
Recommended For
Sales team market analysis presentations, marketing team customer segmentation reports, finance team budget status updates, and executive portfolio analysis. Particularly effective when comparing four or more categories where center emphasis is needed over standard pie charts.
-
Slide Structure
Two-slide set with first slide featuring lime green, teal, gray, and black 4-series donut chart with three right-side text boxes, and second slide with pink, gray, and black 3-series donut chart with three right-side text boxes. Each donut center includes a designated area for emphasizing key performance indicators.
Related Products
-

Visualizing Value Ratios with Pie Charts – Essential Presentation Template
#Market and Competitor Analysis #Diagram #Graph
-

How to Protect Your Environment Pie Chart
#Market and Competitor Analysis #Graph #Market Status
-

Visualizing Fish Market Share with Doughnut Chart – Vitality of the Ocean
#Market and Competitor Analysis #Graph #Market Status
-

Doughnut Chart Visualizing Proportion of Grain Yields
#Market and Competitor Analysis #Graph #Market Status
