Distribution Graph of Food Materials – Market Status Chart
RJ0800046_6
- Last Update 08/13/2025
- File Size 17MB
- # of Slides 2
- File Format PPTX
- Slide Ratio 16:9
- Color
Keywords
- #Content-Based Slides
- #Design-Based Slides
- #Market and Competitor Analysis
- #Graph
- #Other
- #Market Status
- #Market Share
- #Circles
- #Doughnut Chart
- #Mockup
- #16:9
- #donut chart PowerPoint slide
- #pie chart presentation template
- #food distribution market analysis PPT
- #market share visualization
- #how to create donut chart in PowerPoint
About the Product
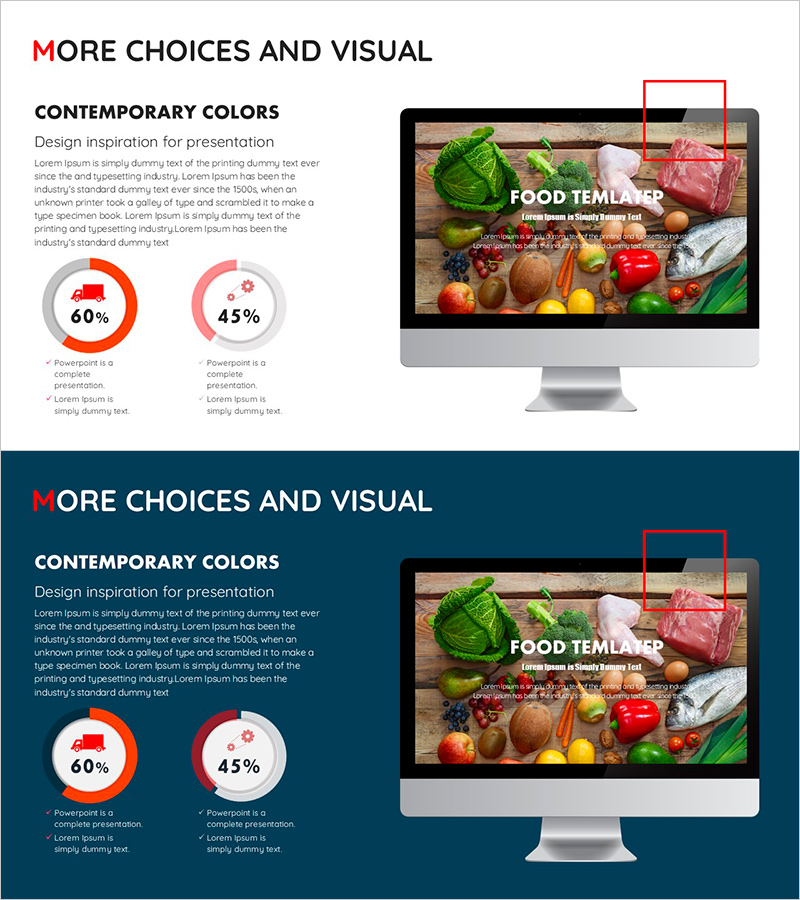
A donut chart PowerPoint slide that visualizes food materials distribution market status with two-segment pie graph design. The red and pink dual-tone color scheme presents market share, sales channel distribution, and logistics ratio data in an intuitive visual format. White background with red accent text emphasizes key metrics (60%, 45%), while checkmark bullet points organize supporting details for each segment. Ready-to-use for food distribution industry presentations, agricultural marketing reports, and market analysis briefings.
Usage Points
-
Main Usage
Clearly presents two-segment proportional data such as market share, sales channel distribution, and logistics structure ratios using donut chart format. Optimized for emphasizing key statistics in data-driven market analysis presentations.
-
How to Use
Insert into market analysis sections, business status reports, and distribution strategy presentation slides. Edit segment values and legends with your own data, and customize bullet point descriptions by adding or removing items as needed.
-
Recommended For
Food distribution companies, agricultural marketing managers, market research analysts, distribution channel strategists, and supply chain professionals presenting market status, business proposals, and quarterly performance reports.
-
Slide Structure
Two-slide layout with light background and red accent on the first slide, dark navy background with red accent on the second. Each slide contains one two-segment donut chart, two metric displays (60%, 45%), and four checkmark bullet points for supporting information.
Related Products
-

Market Share and Usage Status by Application – Statistical Analysis
#Market and Competitor Analysis #Graph #Other
-

Leaf Illustration Donut Chart - Visualizing Market Share
#Market and Competitor Analysis #Graph #Market Status
-

Office Desk Donut Chart Analysis – Visualizing Market Share
#Market and Competitor Analysis #Graph #Market Status
-

Enrollment Stats & Ratios Donut Chart
#Market and Competitor Analysis #Graph #Market Status
