Progress Process Diagram for Business Strategy
RJ0500007_11
- Last Update 06/09/2025
- File Size 1.2MB
- # of Slides 2
- File Format PPTX
- Slide Ratio 16:9
- Color
Keywords
- #Content-Based Slides
- #Design-Based Slides
- #Business Strategy
- #Operational Plan
- #Diagram
- #Business Processes
- #Cluster
- #Chain Diagram
- #Project Progress
- #16:9
- #circular process diagram PowerPoint
- #3-step diagram slide
- #business progress PowerPoint template
- #process flow diagram slide
- #operational workflow PPT slide
About the Product
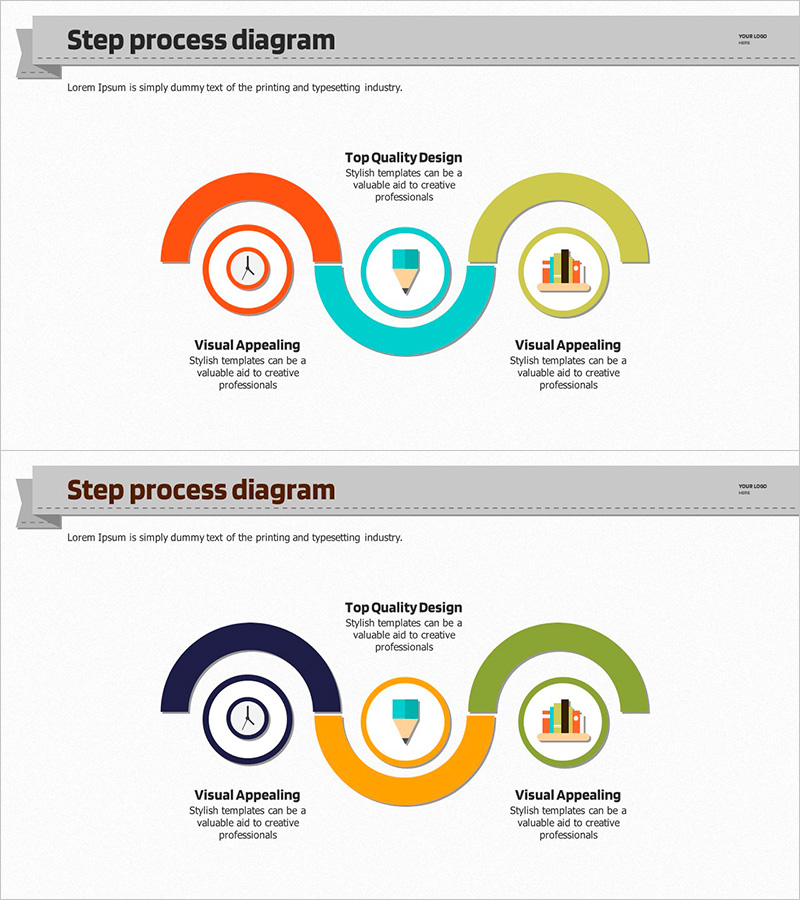
A 3-step circular process diagram PowerPoint slide that visualizes business strategy progression and operational workflow. Three circular nodes in orange, teal, and lime are connected by a central teal curved line, with clock, funnel, and bar chart icons representing time management, quality design, and performance measurement. Two color variations (orange-teal-lime and navy-orange-lime) allow customization to match corporate branding. Ideal for business progress reports, operational planning presentations, and process improvement meetings. Fully editable PPTX format with 16:9 aspect ratio.
Usage Points
-
Main Usage
Illustrates business strategy progression through a cyclical structure that emphasizes interconnection and continuous improvement. Three key elements—time management, quality design, and performance measurement—are highlighted with icons to enhance audience comprehension and engagement.
-
How to Use
Deploy in business progress reports, operational planning presentations, and process improvement meetings to explain stage objectives and deliverables. Customize text areas with specific timelines, responsible parties, and expected outcomes to align team understanding and accountability.
-
Recommended For
Business planning teams, operations managers, project leads, and executives presenting strategy updates. Particularly effective for mid-term business plans (3-12 months) and quarterly operational goal achievement presentations requiring clear phase visualization.
-
Slide Structure
Three circular nodes (approximately 80px diameter) connected by a central teal curved line. Each node contains an icon (clock, funnel, bar chart) with adjacent text areas for title and description. Two color schemes provided: Slide 1 features orange-teal-lime; Slide 2 features navy-orange-lime for flexible branding alignment.
Related Products
-

Connection Diagram: Key Elements of Speech Concept
#Business Strategy #Operational Plan #Diagram
-

Diagrams of the Dangers of Alcoholism – Effective Awareness and Warning
#Business Strategy #Operational Plan #Diagram
-

Visualizing Logistics Transportation System – Strategic Operational Management
#Business Strategy #Operational Plan #Diagram
-

Express Your Business Push Strategy with Green-Blue Connected Diagram
#Business Strategy #Operational Plan #Diagram
