Diet Consulting and Strategies PowerPoint Slide – Practical Approach
RJ0800048_14
- Last Update 08/13/2025
- File Size 0.2MB
- # of Slides 2
- File Format PPTX
- Slide Ratio 16:9
- Color
Keywords
- #Content-Based Slides
- #Design-Based Slides
- #Product/Service Introduction
- #Operational Plan
- #Diagram
- #Differentiation Strategy for Products/Services
- #Business Processes
- #Cluster
- #Chain Diagram
- #16:9
- #overlapping Venn diagram PowerPoint
- #4-section comparison slide
- #relationship diagram template
- #intersection chart PowerPoint
- #how to create Venn diagram in PowerPoint
About the Product
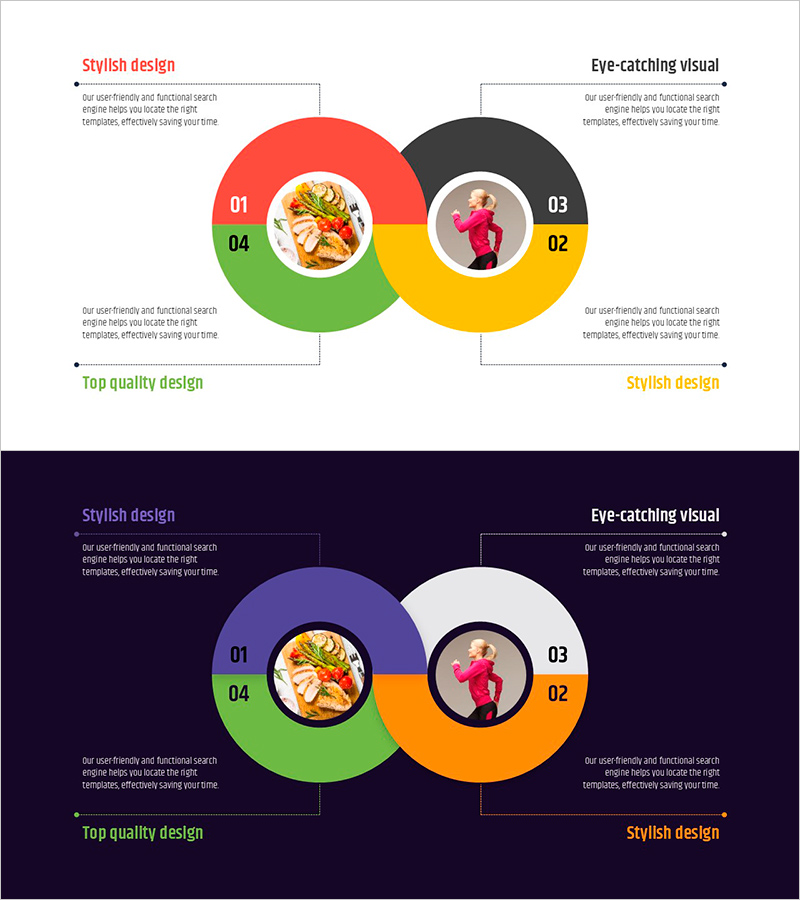
A professional PowerPoint slide featuring two overlapping circular diagrams that visualize relationships and intersections across four distinct areas. Color-coded sections in red, black, yellow, and green help differentiate each area, while centered image frames emphasize your key message. Text annotation areas above and below allow detailed descriptions of each section. This presentation template is ready to use for comparative analysis, strategy development, stakeholder mapping, and client requirement assessment in business presentations.
Usage Points
-
Main Usage
Displays relationships, intersections, and distinctions among four elements simultaneously using two overlapping circular structures. Perfect for business strategy, customer segmentation, product positioning, organizational roles, and complex data comparison.
-
How to Use
Enter text and data into each colored section to define comparison items. Insert relevant images or icons in the central frames to reinforce your topic. Use annotation areas at top and bottom to clarify the meaning of each section.
-
Recommended For
Marketing strategy presentations, customer needs analysis, product positioning, organizational role definition, business model explanation, consulting proposals, training seminars, and stakeholder communication.
-
Slide Structure
2-slide set. Slide 1 features light background with red, black, yellow, and green overlapping circles numbered 01-04. Slide 2 uses dark background with identical structure. Each section includes text areas and two circular image frames positioned centrally.
Related Products
-

Visualizing Logistics Business Process with Diagram Slide
#Product/Service Introduction #Operational Plan #Diagram
-

Business Service Differentiation Strategy – Diagram for Successful Operations
#Product/Service Introduction #Operational Plan #Diagram
-

Creative Connection Diagram – Product and Service Differentiation Strategy
#Product/Service Introduction #Operational Plan #Diagram
-

Successful Business Strategy Diagram
#Product/Service Introduction #Operational Plan #Diagram
