Donut Charts by Technology – Market Status and Competitive Advantage
RJ0900017_5
- Last Update 08/21/2025
- File Size 0.3MB
- # of Slides 2
- File Format PPTX
- Slide Ratio 16:9
- Color
Keywords
About the Product
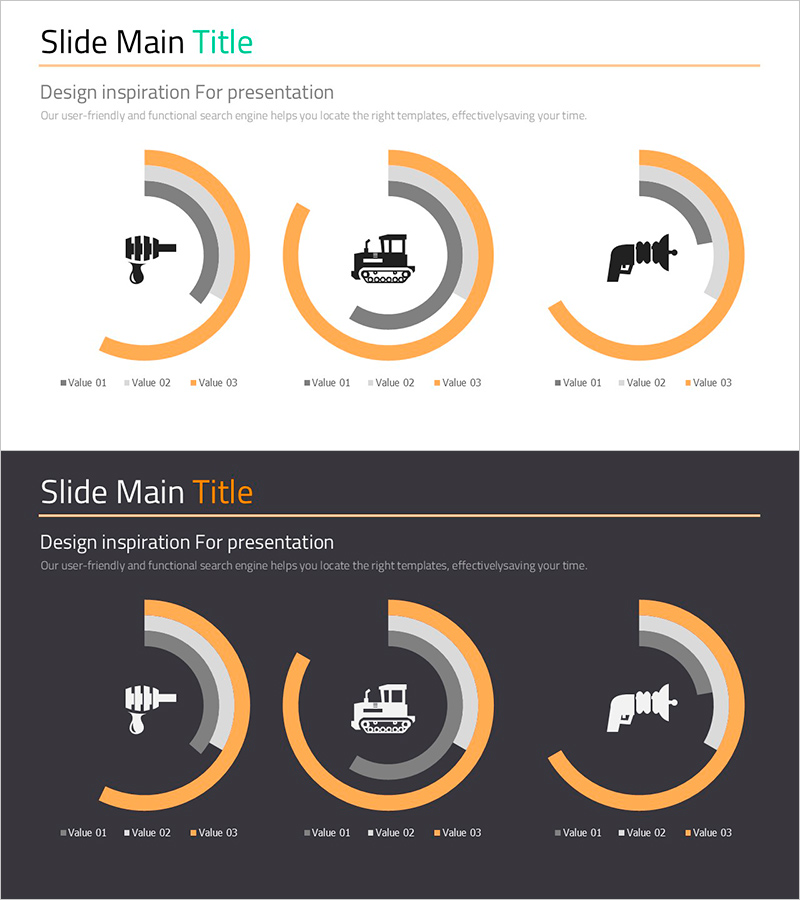
A three-layer donut chart PowerPoint slide designed to visualize technology-based market status and competitive advantage. The concentric ring structure expresses hierarchical data from center to outer edge, with clear color contrast in orange, gray, and black tones to distinguish each technology category. The 2-slide set provides both light and dark background layouts to match your presentation environment and design tone. Each donut ring includes Value 01, 02, 03 legend labels for clear information hierarchy, while icons (microphone, construction equipment, camera) intuitively represent technology fields. Delivered in 16:9 widescreen PPTX format, fully editable and ready to customize with your own data.
Usage Points
-
Main Usage
Designed to present multi-layered quantitative data such as technology market share, competitor comparison, and product feature distribution at a glance. The donut structure utilizes center space for key metrics or titles, maximizing information delivery efficiency.
-
How to Use
Use in technology strategy presentations, market analysis reports, and product positioning decks to emphasize competitive advantage and technical capabilities. Light background slides suit standard conference rooms, while dark background works best for large-screen presentations. Freely edit legend labels and values to reflect your actual data.
-
Recommended For
Technology planning teams, marketing strategists, product managers, and executives preparing market analysis and competitive positioning reports. Particularly effective for strategy presentations in technology-driven industries such as IT, manufacturing, energy, and telecommunications.
-
Slide Structure
2-slide set: Slide 1 features light background (white/light gray) with orange, gray, and black donut rings; Slide 2 uses dark background (charcoal gray) with identical chart design. Each slide displays 3 donut charts positioned left, center, and right, with legend labels (Value 01, 02, 03) below to indicate data series. 16:9 widescreen format.
Related Products
-

SUV Percentage Donut Graph – Market Status Analysis
#Market and Competitor Analysis #Diagram #Graph
-

Comparative Competition Donut Chart – Market and Competitor Analysis
#Market and Competitor Analysis #Graph #Market Status
-

Donut Chart of Credit Card Spending Categories – Market Insights
#Market and Competitor Analysis #Graph #Market Status
-

Achievement Goals and Status Chart – Visualizing Competitive Advantage
#Market and Competitor Analysis #Graph #Market Status
