Current Network Deployment by Region – Donut Chart Visualization
RB0100043_5
- Last Update 03/05/2025
- File Size 1.8MB
- # of Slides 2
- File Format PPTX
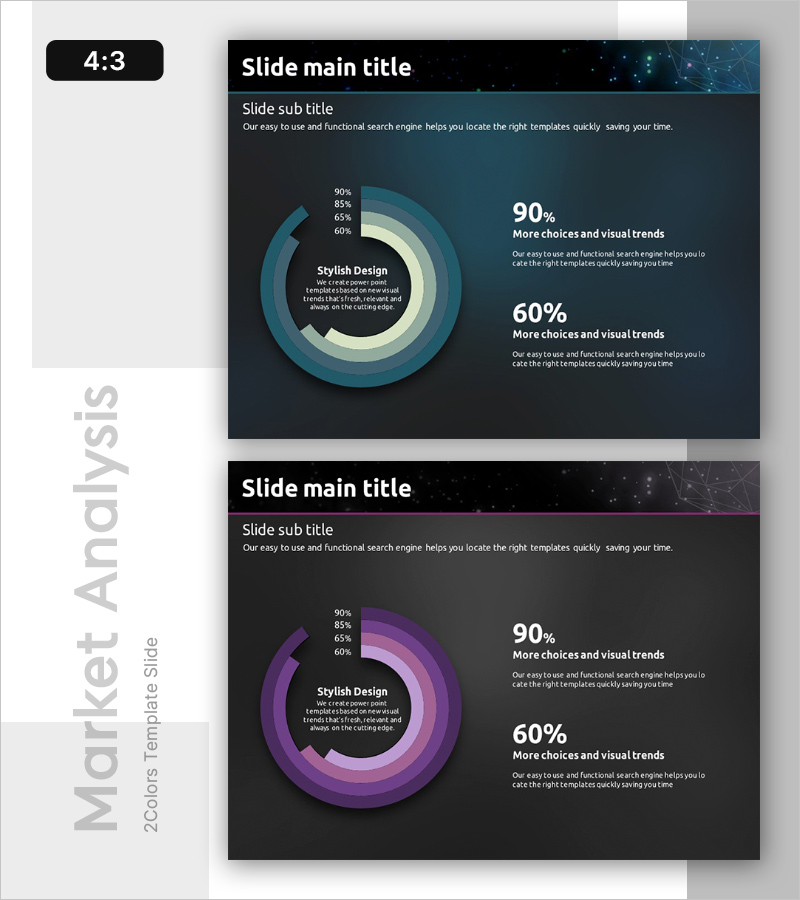
- Slide Ratio 4:3
- Color
Keywords
About the Product
A 2-slide PowerPoint set featuring a 4-layer donut chart for visualizing regional and network deployment data. The concentric circular chart displays percentages (90%, 85%, 65%, 60%) in teal and purple gradient tones, enabling intuitive comparison of multi-level metrics. Each layer includes percentage labels and dedicated text areas for descriptions, making it ideal for market share analysis, growth rates, and regional performance reporting. Fully editable in 4:3 PPTX format, suitable for corporate presentations, strategic reviews, and business intelligence dashboards.
Usage Points
-
Main Usage
Visualize multi-layered percentage data (market share, regional distribution, growth metrics) using a 4-layer donut chart. The concentric circular structure enables clear comparison of hierarchical information while maintaining visual clarity and professional appearance.
-
How to Use
Use in quarterly/annual business reviews, market analysis presentations, investor pitch decks, strategic planning meetings, and performance reports. Replace percentage values and text descriptions with your own data. Drag-and-drop editing in PowerPoint for quick customization.
-
Recommended For
Executives, CFOs, marketing managers, business analysts, regional managers, and strategy teams presenting quantitative performance metrics, market penetration, and network deployment status to stakeholders and investors.
-
Slide Structure
2-slide set. Each slide contains a 4-layer concentric donut chart (90%, 85%, 65%, 60% from center) with right-aligned text area (title, subtitle, 3-4 lines of description). Teal-to-purple gradient applied throughout. 4:3 aspect ratio, fully editable PPTX format.
Related Products
-

Market Status Analysis with Donut Chart – Attractive Colors
#Market and Competitor Analysis #Graph #Market Status
-

Doughnut Chart Slide for Market and Competitive Analysis – Sports Trends & Strategic Issues
#Market and Competitor Analysis #Diagram #Graph
-

SUV Percentage Donut Graph – Market Status Analysis
#Market and Competitor Analysis #Diagram #Graph
-

Current Status as Seen in a Donut Chart – Slide Representing Competitive Advantage
#Market and Competitor Analysis #Graph #Market Status
