Comparative Donut Charts by Data Type – Market Status and Competitive Advantage
RB0100032_7
- Last Update 03/04/2025
- File Size 3.2MB
- # of Slides 2
- File Format PPTX
- Slide Ratio 4:3
- Color
Keywords
- #Content-Based Slides
- #Design-Based Slides
- #Market and Competitor Analysis
- #Graph
- #Market Status
- #Competitive Advantage
- #Circles
- #Doughnut Chart
- #4:3
- #donut chart PowerPoint
- #pie chart slide template
- #comparative analysis chart
- #market status presentation
- #competitive advantage visualization
- #donut graph download
About the Product
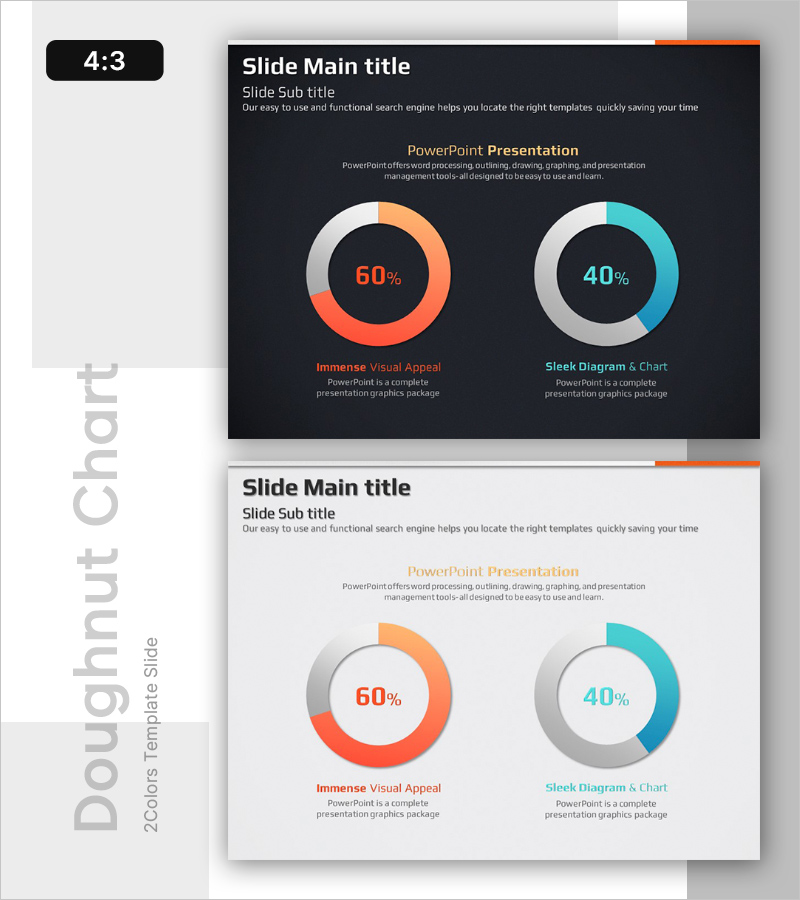
A dark blue background PowerPoint slide featuring two donut charts positioned side by side with orange and cyan accent colors. Each donut displays a percentage value at the center and includes labels with descriptive text below, optimized for market status, competitive advantage, and comparative data visualization. This 4:3 ratio, 2-slide presentation is fully editable and ready to use immediately.
Usage Points
-
Main Usage
Visualizes two comparative metrics simultaneously such as market analysis, competitor benchmarking, or data comparison in presentations. The percentage values at the donut center emphasize key data, while bottom labels clearly distinguish categories and enhance audience comprehension.
-
How to Use
Use in investor presentations, business reports, and marketing strategy meetings to display two comparative indicators side by side (e.g., our company vs. competitors, year-over-year comparison). Double-click the donut values and labels to edit and input your actual data.
-
Recommended For
Recommended for executives, marketing teams, strategy planners, and finance departments presenting market analysis, performance comparisons, and competitive positioning. Particularly effective in B2B investor pitches, quarterly business reviews, and strategic planning sessions to enhance data credibility.
-
Slide Structure
2-slide set with dark blue background. Each slide displays two donut charts (left orange 60%, right cyan 40%) positioned horizontally with percentage values centered and labels with descriptive text below. 4:3 ratio PPTX format with fully editable elements.
Related Products
-

Donut Charts by Technology – Market Status and Competitive Advantage
#Market and Competitor Analysis #Graph #Market Status
-

Current Network Deployment by Region – Donut Chart Visualization
#Market and Competitor Analysis #Graph #Market Status
-

Current Status as Seen in a Donut Chart – Slide Representing Competitive Advantage
#Market and Competitor Analysis #Graph #Market Status
-

Achievement Goals and Status Chart – Visualizing Competitive Advantage
#Market and Competitor Analysis #Graph #Market Status
