Two Comparison Line Graphs – Market Status and Future Outlook
RJ0500009_16
- Last Update 06/09/2025
- File Size 0.3MB
- # of Slides 2
- File Format PPTX
- Slide Ratio 16:9
- Color
Keywords
About the Product
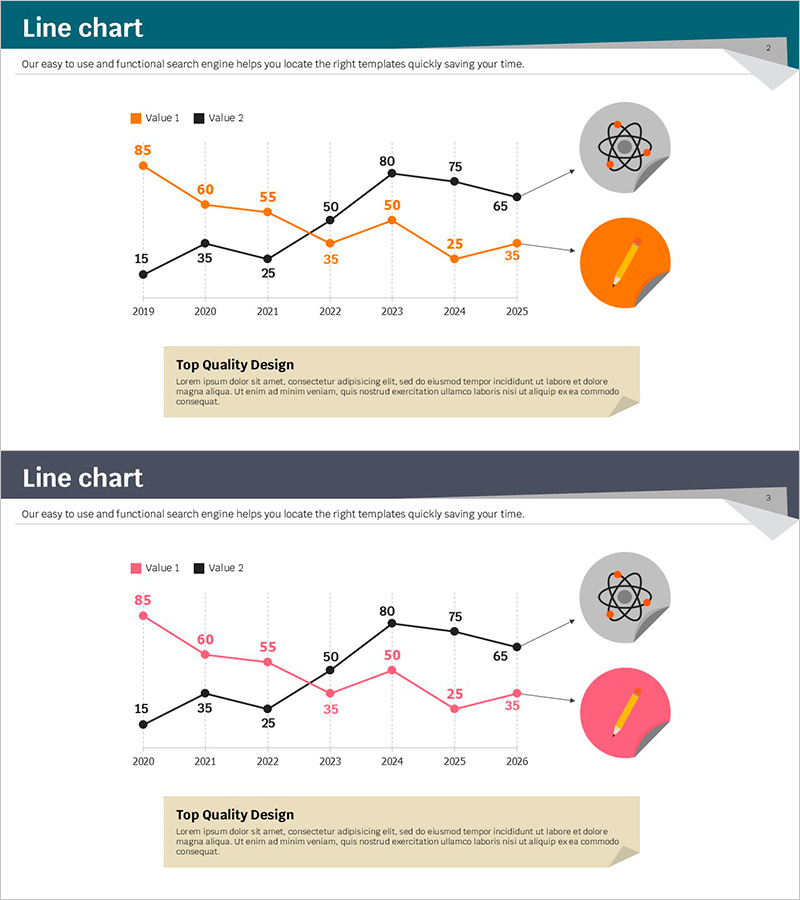
A dual-series line chart PowerPoint slide that visualizes market status and future outlook simultaneously. The orange and black data series clearly display changes from 2019 to 2025, with numerical values marked at each data point for precise information delivery. Grid lines and legend are included for immediate presentation use, while the right side features an icon and text box to emphasize key messages. This slide template is ideal for competitive analysis, market trend comparison, performance tracking, and various business presentations.
Usage Points
-
Main Usage
Designed to compare two data series such as market status versus future outlook, competitive performance metrics, or year-over-year trends. Numerical values at each data point enable precise information delivery and clear visualization of change patterns.
-
How to Use
Use in business plans, marketing proposals, quarterly performance reports, and market analysis sections. Add key insights or messages to the right-side icon and text box area to enhance presentation impact and audience engagement.
-
Recommended For
Marketing managers, business planners, financial analysts, and consultants who require data-driven decision-making. Particularly effective for presentations covering market analysis, performance comparison, and trend forecasting.
-
Slide Structure
Two slides with identical structure, each containing a dual-series line chart with orange and black lines representing seven years of data points from 2019 to 2025. Includes legend, grid lines, and numerical labels. Right side features a circular icon and text area for key message emphasis.
Related Products
-

Electricity and Water Usage Graphs – Market Status and Future Trends
#Market and Competitor Analysis #Graph #Market Status
-

Line Graph Slide Visualizing Ocean Market Trends
#Market and Competitor Analysis #Graph #Market Status
-

Four Color Infographic Presentation Template – Market Status and Forecast
#Market and Competitor Analysis #Graph #Market Status
-

Successful Proposition Strategy through Market and Competitive Analysis
#Market and Competitor Analysis #Graph #Market Status
