Market Analysis with Horizontal and Vertical Bar Charts – Recent Trends Review
RJ0600088_17
- Last Update 07/14/2025
- File Size 0.6MB
- # of Slides 2
- File Format PPTX
- Slide Ratio 16:9
- Color
Keywords
- #Content-Based Slides
- #Design-Based Slides
- #Market and Competitor Analysis
- #Financial Plans and Performance
- #Diagram
- #Graph
- #Market Status
- #Industry Trends
- #Capital Requirements
- #Table
- #Column
- #Standard Table
- #Segmented Column
- #16:9
- #vertical bar chart PowerPoint
- #bar graph slide template
- #market analysis chart
- #trend comparison graph
- #data visualization PowerPoint slide
About the Product
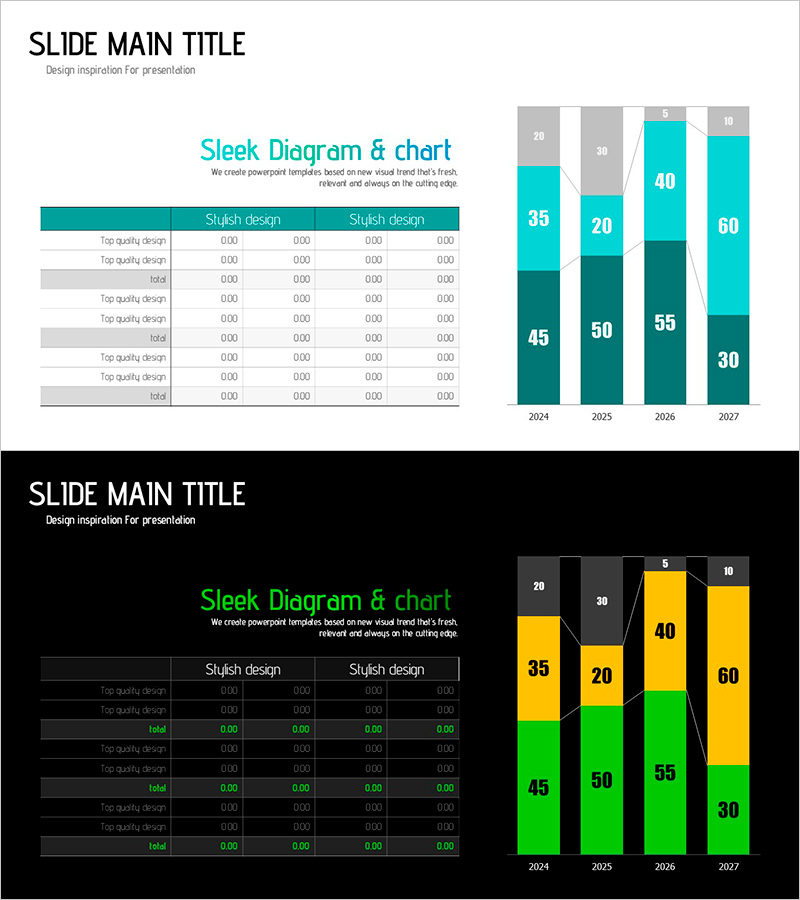
A vertical bar chart PowerPoint slide designed to visualize market analysis and recent trends over time. This presentation template displays data from 2024 to 2027 across four years using three color series: cyan, green, and dark teal, enabling clear year-over-year comparison of cumulative values. The left side features a data input table while the right side showcases the corresponding bar graph, creating a cohesive layout ideal for quantitative analysis. Perfect for market overview sections in presentations, reports, and business proposals.
Usage Points
-
Main Usage
Presents market conditions and year-over-year trend comparisons in quantitative form. The vertical bar chart clearly visualizes numerical changes across multiple categories, while the combined table and graph layout provides credible analytical material for business presentations.
-
How to Use
Enter quarterly or category-specific figures in the left table, and the right graph updates automatically. Customize each series color to match your brand identity, and adjust year ranges and item counts to fit various market analysis datasets.
-
Recommended For
Marketing professionals, planning teams, and executives presenting market trends, quarterly performance reports, and competitive analysis. Recommended for market analysis sections in business plans, marketing proposals, and investor presentations.
-
Slide Structure
2-slide set. Slide 1 is a title slide. Slide 2 contains a 4-row by 4-column data input table on the left and a vertical bar graph showing 4 years with 3 stacked series on the right. Optimized for 16:9 widescreen format.
Related Products
-

Core Technologies of AI Chipsets: Performance Characteristics
#Market and Competitor Analysis #Diagram #Graph
-

Farm Subdivision Vertical Bar Graph – Market Trend Analysis
#Market and Competitor Analysis #Graph #Market Status
-

Comparison Chart of Pet Expenditure – Essential Template for Competitor Analysis
#Market and Competitor Analysis #Diagram #Graph
-

Hologram Wide PPT Table & Segmentation Bar Graph – Trendy Data Visualization
#Market and Competitor Analysis #Financial Plans and Performance #Diagram
