Technology Status Analysis Graph – Presenting Market Trends
RJ0900013_18
- Last Update 08/19/2025
- File Size 0.3MB
- # of Slides 2
- File Format PPTX
- Slide Ratio 16:9
- Color
Keywords
- #Content-Based Slides
- #Design-Based Slides
- #Market and Competitor Analysis
- #Financial Plans and Performance
- #Graph
- #Industry Trends
- #Capital Requirements
- #Column
- #Segmented Column
- #16:9
- #100% stacked bar chart PowerPoint
- #horizontal bar graph slide template
- #cumulative percentage chart
- #market analysis graph
- #technology status analysis slide
- #data comparison PowerPoint template
About the Product
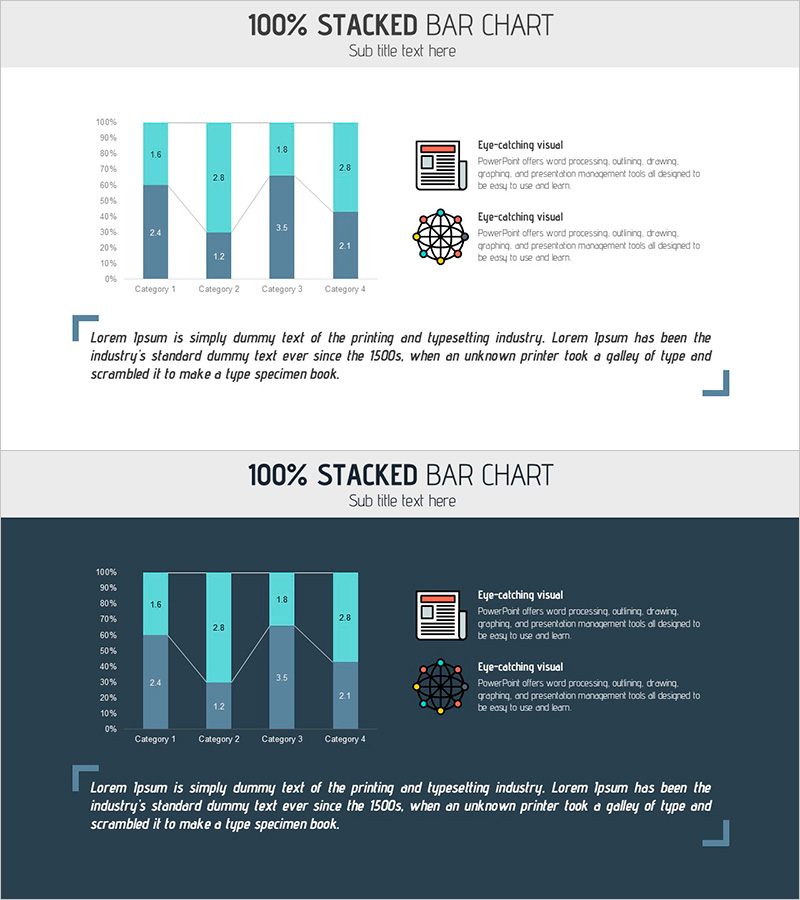
A 100% stacked horizontal bar chart PowerPoint slide designed for technology status analysis and market trend visualization. Four categories display cumulative percentage composition using a teal and dark gray two-tone color scheme that clearly differentiates data layers. Each bar includes numeric labels, and an overlaid line chart simultaneously represents trend changes across categories. This 2-slide set is ready to use in presentations, reports, and analytical documents where you need to communicate both compositional ratios and change trajectories together.
Usage Points
-
Main Usage
Visualize technology status analysis, market trend comparison, and compositional ratio changes in a single slide. The stacked bar format shows each item's share relative to the total, while the overlaid line emphasizes temporal change patterns.
-
How to Use
Apply in technology reports, market analysis presentations, strategy meetings, and investor briefings to efficiently convey multi-layered data. Double-click each bar segment to edit values, and adjust line data points to reflect actual analysis results.
-
Recommended For
Data analysts, marketing managers, technology leaders, and executives. Ideal when explaining both compositional shifts and trends simultaneously. Suitable for quarterly or annual technology stack evolution, market share trajectories, and product feature composition changes.
-
Slide Structure
Slide 1: Light gray background, title area, 4-category 100% stacked horizontal bar (teal, dark gray, mid-tone 3-level), trend line overlay, legend, numeric labels. Slide 2: Dark navy background version with identical structure. 16:9 aspect ratio, 2-slide set.
Related Products
-

Four-Year Industrial Market Trends – Market Analysis and Decisions
#Market and Competitor Analysis #Financial Plans and Performance #Graph
-

Market Analysis with Horizontal and Vertical Bar Charts – Recent Trends Review
#Market and Competitor Analysis #Financial Plans and Performance #Diagram
-

Backpack Travel Trends – Market Growth Forecast
#Market and Competitor Analysis #Graph #Industry Trends
-

Growth Graphs and Product Production Strategies Using Bar Charts
#Operational Plan #Market and Competitor Analysis #Diagram
