Graph Slide for Visual Data Analysis – Trends and Choices
RJ0900017_16
- Last Update 08/20/2025
- File Size 0.3MB
- # of Slides 2
- File Format PPTX
- Slide Ratio 16:9
- Color
Keywords
About the Product
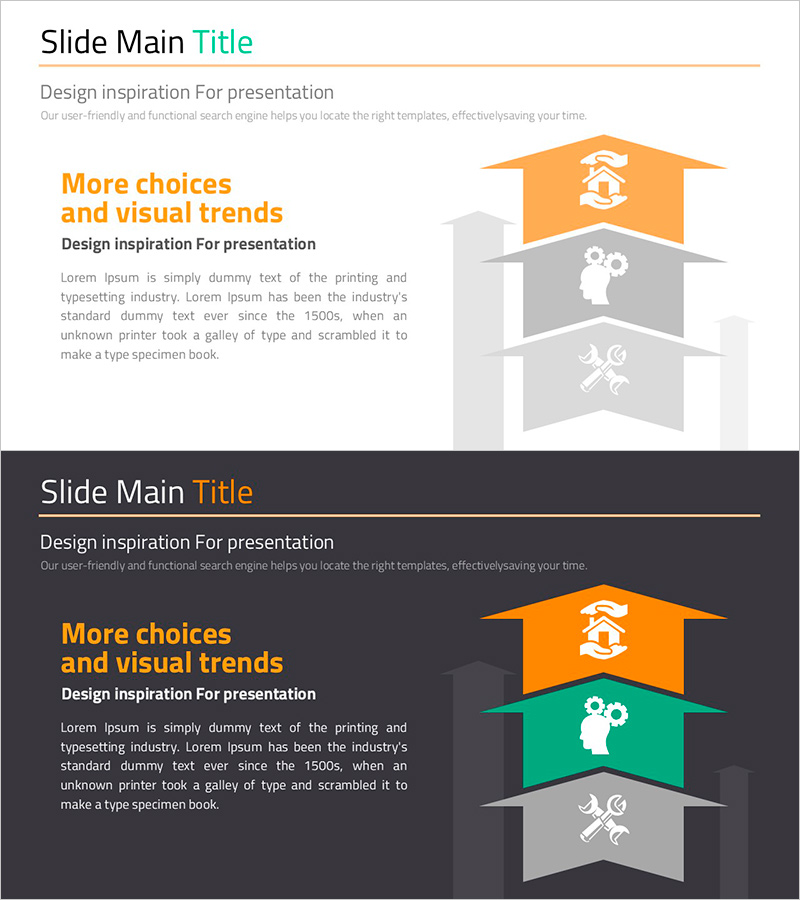
A 3-level hierarchical banner chart PowerPoint slide designed to present business data and insights with visual clarity. Three distinct color bands—orange, green, and gray—separate priority levels, categories, and sequential data for immediate comprehension. Each banner features an icon (hand, gear, tools) that transforms abstract concepts into concrete visual symbols, with dedicated text areas for detailed explanations. The 2-slide set includes both light and dark background versions, adapting to various presentation environments and lighting conditions. Formatted in 16:9 widescreen standard with fully editable PPTX compatibility for seamless customization.
Usage Points
-
Main Usage
Simplifies complex data into a 3-tier hierarchy, enhancing audience comprehension. Color-coded and icon-enhanced banners enable instant recognition of priorities, categories, and sequential steps. Applicable across business strategy, organizational structure, process workflows, and comparative analysis.
-
How to Use
Insert category names, stage labels, or descriptions into each banner text field. Customize or remove icons to match your concept. Select the light background version for daytime presentations and print materials; use the dark version for evening events and video recordings.
-
Recommended For
Executives, marketing teams, strategic planners, data analysts, and consultants explaining business strategies, market analysis, organizational restructuring, and project phases. Ideal for investor presentations, executive reports, strategy workshops, and educational seminars requiring clear information hierarchy.
-
Slide Structure
Three horizontal banners arranged vertically, each color-coded (orange, green, gray). Left side displays icons (hand, gear, tools); center contains title area; right side provides text description space. Includes both light (white background) and dark (black background) versions for flexible deployment.
Related Products
-

Market Demand Analysis PowerPoint Slide – Donut Chart Layout
#Market and Competitor Analysis #Graph #Customer Analysis
-

Enrollment Stats & Ratios Donut Chart
#Market and Competitor Analysis #Graph #Market Status
-

Market Outlook Insights with Bar Graph – Visualizing Business Performance
#Market and Competitor Analysis #Graph #Future Outlook
-

Salt Farm Production Analysis – Market Situation Visualization
#Market and Competitor Analysis #Graph #Market Status
