Market Outlook Insights with Bar Graph – Visualizing Business Performance
RB0200017_4
- Last Update 03/08/2025
- File Size 1.6MB
- # of Slides 2
- File Format PPTX
- Slide Ratio 4:3
- Color
Keywords
About the Product
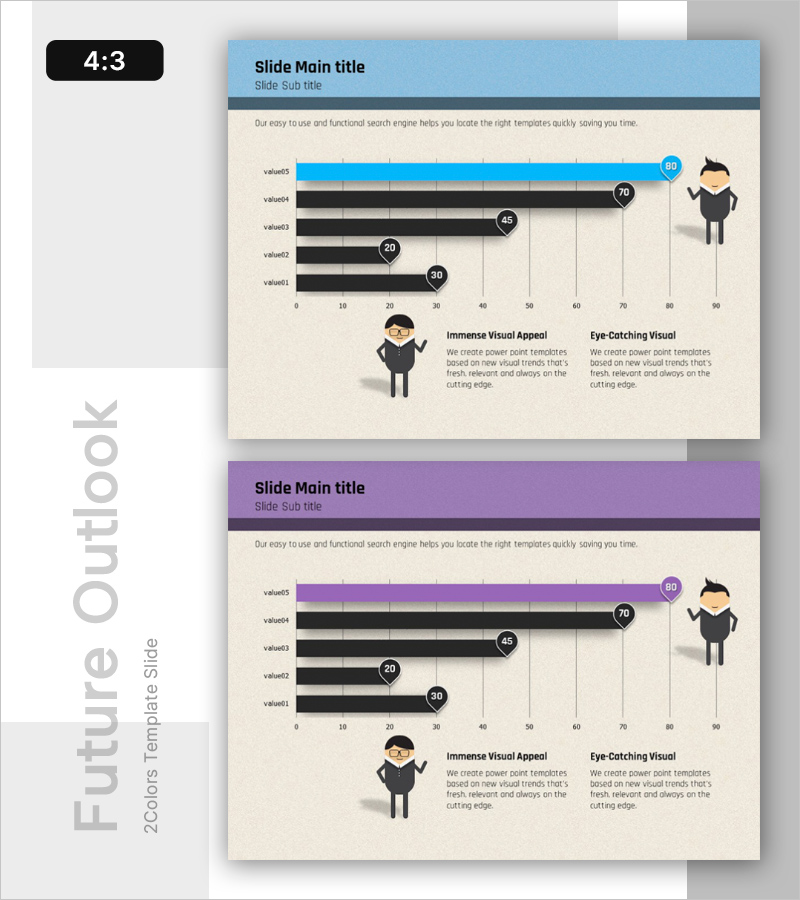
A horizontal bar chart PowerPoint slide designed to compare market outlook and business performance at a glance. This presentation template visualizes five data items with a blue accent bar and black comparison bars, each marked with circular badges displaying numerical values. Character illustrations and text description areas are positioned to enhance information delivery. Ready to use in reports and presentations, this slide template supports data-driven decision-making and competitive analysis.
Usage Points
-
Main Usage
Visualize and compare numerical data across five items such as market outlook, sales performance, or competitor metrics using horizontal bars. The blue accent bar highlights the leading value while black bars enable comparison with other items, making key data stand out.
-
How to Use
Insert this slide into executive reports, quarterly performance presentations, or market analysis decks where numerical comparison is required. Edit bar lengths and values with your own data, then add insights in the text area next to the character illustration to complete your storytelling.
-
Recommended For
Marketing managers, sales directors, and business planning teams presenting quarterly results, market share comparisons, or competitive advantage analysis. Ideal for executive briefings requiring data-driven insights and performance metrics.
-
Slide Structure
Two-slide set with blue header (title and subtitle), beige content area, five horizontal bars (one blue accent, four black comparison), circular badge value indicators, left-side character illustration, and right-side text description area. Formatted in 4:3 aspect ratio for standard presentations.
Related Products
-

Monthly Market Analysis with Horizontal Bar Chart – Shaping the Future of the Market
#Market and Competitor Analysis #Graph #Future Outlook
-

Horizontal Bar Chart with Highlighted Emphasis – Market and Competitive Analysis
#Market and Competitor Analysis #Graph #Future Outlook
-

Successful Business Future Outlook Analysis Graph
#Market and Competitor Analysis #Diagram #Graph
-

Collaborative Business Market Revenue Analysis Graph - Data-Driven Insights
#Market and Competitor Analysis #Graph #Future Outlook
