Doughnut Charts and Table Illustrations – Market Analysis Tool
RJ0900016_5
- Last Update 08/20/2025
- File Size 0.1MB
- # of Slides 2
- File Format PPTX
- Slide Ratio 16:9
- Color
Keywords
About the Product
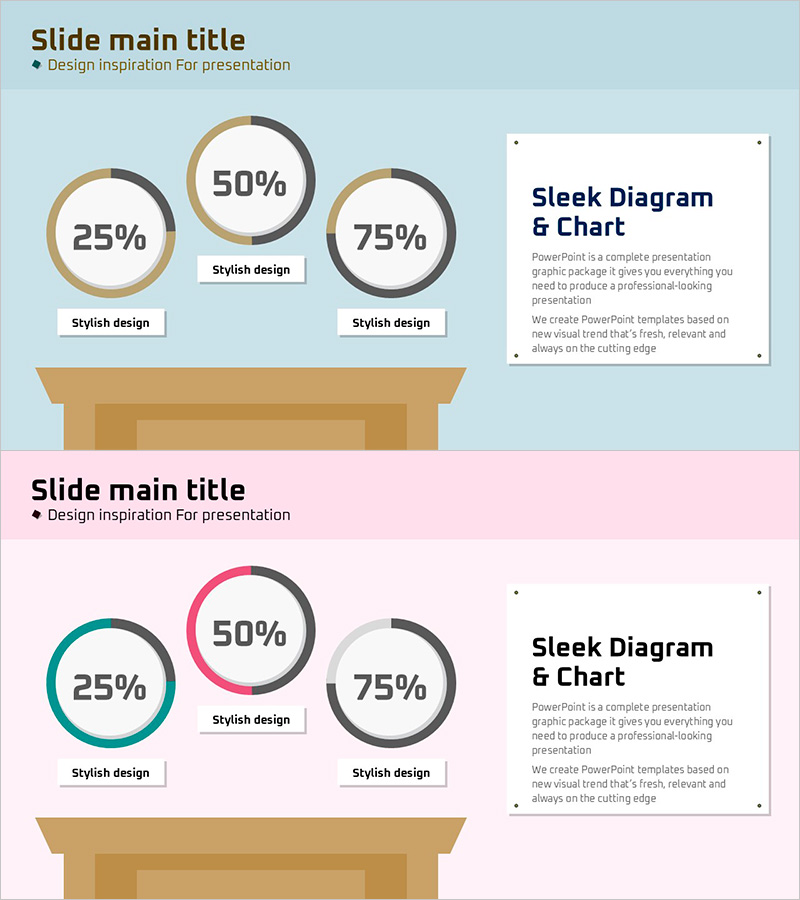
A professional doughnut chart PowerPoint slide designed for market analysis and share comparison presentations. This slide features three doughnut pie charts displaying 25%, 50%, and 75% proportions, paired with a table illustration for data visualization and explanatory text. The design combines light blue and beige backgrounds with gold and charcoal doughnut ring accents, creating clear visual contrast. Each chart includes a 'Stylish design' label for category clarity. The 2-slide set is optimized for 16:9 widescreen format and ready for immediate use in business presentations, marketing reports, financial analysis decks, and competitive positioning slides.
Usage Points
-
Main Usage
Visually represent market share, sales ratios, customer distribution, and part-to-whole relationships using doughnut pie charts. The three-chart layout enables simultaneous comparison of multiple data segments, while the table illustration supports contextual explanation and narrative text placement.
-
How to Use
Apply this slide in marketing reports for market analysis sections, financial presentations for revenue composition analysis, business plans for customer demographic distribution, and competitive analysis decks. Simply replace the percentage values with your data, edit labels and description text, and the slide is ready for presentation.
-
Recommended For
Marketing managers, financial analysts, business strategists, sales directors, and data-driven professionals who need to communicate comparative ratio analysis. Ideal for quarterly business reviews, investor presentations, market research summaries, and strategic planning meetings.
-
Slide Structure
2-slide set. Slide 1 features a light blue background with 3 doughnut charts (25%, 50%, 75% values), text labels below each chart, and an explanation box on the right. Slide 2 uses a pink background with identical doughnut structure but highlights the left chart in teal and right chart in pink for color variation. All elements are optimized for 16:9 widescreen format with consistent spacing and alignment.
Related Products
-

Recent Market Status Slide with Donut Chart
#Market and Competitor Analysis #Graph #Market Status
-

Halloween Share Chart – Market Analysis and Visual Communication
#Market and Competitor Analysis #Graph #Market Share
-

Palm Donut Chart – Market Share and Data Visualization
#Market and Competitor Analysis #Graph #Market Share
-

Fashion Design Comparative Donut Chart – Market Share Analysis
#Market and Competitor Analysis #Graph #Market Share
