Market Share Donut Chart for Eco-Friendly Businesses – Trends and Insights
RJ0600051_4
- Last Update 07/04/2025
- File Size 4MB
- # of Slides 2
- File Format PPTX
- Slide Ratio 16:9
- Color
Keywords
- #Content-Based Slides
- #Design-Based Slides
- #Market and Competitor Analysis
- #Graph
- #Market Share
- #Circles
- #Doughnut Chart
- #16:9
- #donut chart PowerPoint
- #pie chart presentation slide
- #market share visualization
- #data visualization template
- #percentage distribution slide
- #how to create donut chart in PowerPoint
About the Product
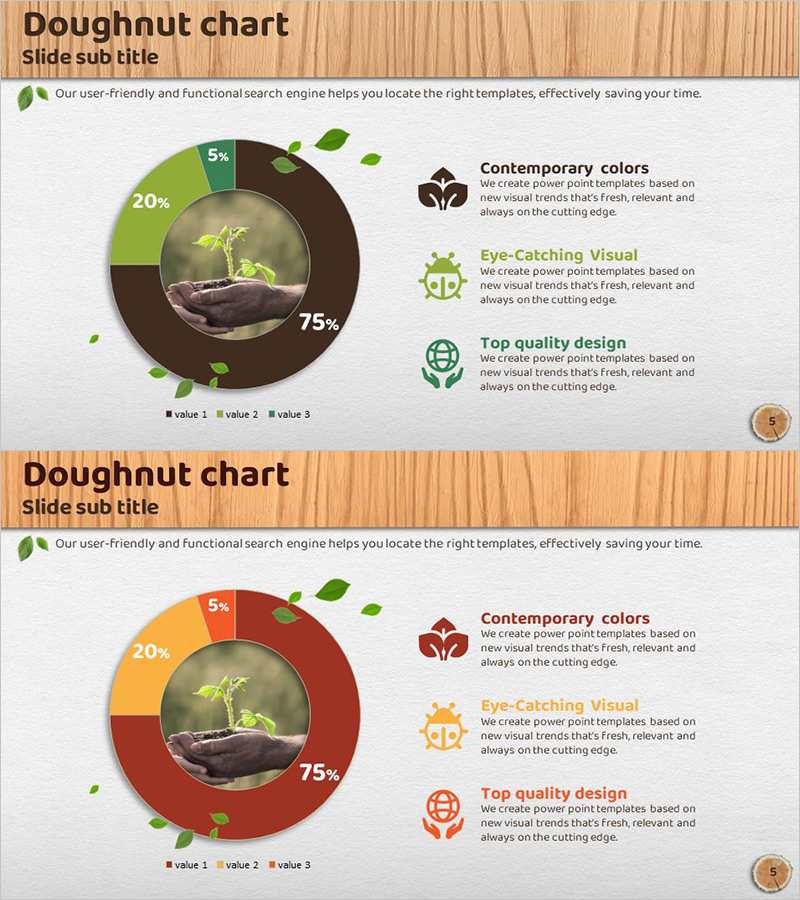
A donut chart PowerPoint slide designed to visualize market share distribution for eco-friendly businesses. This presentation template displays three data segments (75%, 20%, 5%) with a circular image area in the center, allowing you to insert brand logos or product photos for enhanced visual impact. The design features a wood-tone header and a color palette combining dark brown and bright green to convey environmental consciousness. The right side includes three icons with descriptive text boxes highlighting key insights. The 2-slide set offers multiple color variations (brown, orange, and red combinations) to match different presentation contexts. Delivered in 16:9 widescreen PPTX format for immediate editing and customization.
Usage Points
-
Main Usage
Effectively communicate proportional data such as market share, sales distribution, and customer segments. The donut center accommodates product images or logos to reinforce brand messaging, while the right-side icons and text explain each data segment, creating a comprehensive visual narrative.
-
How to Use
Ideal for business performance reports, market research presentations, quarterly results briefings, and investor pitches. Simply double-click the percentage values to edit your data, and insert your company logo or product image in the center circle to maximize visual engagement and brand recognition.
-
Recommended For
Marketing professionals, executives, business analysts, and consultants presenting at board meetings, investor relations events, and market analysis reports. Particularly effective for communicating market positioning and sustainability initiatives in eco-friendly and green business sectors.
-
Slide Structure
Two-slide set with distinct color schemes: the first features brown and green tones, the second uses orange and red combinations. Each slide contains a left-aligned donut chart (3 data series with 75%, 20%, 5% labels), a center circular image placeholder, and a right-side panel with 3 icons and accompanying descriptive text areas.
Related Products
-

Donut Chart Visualizing Merchandise Sales Proportion
#Market and Competitor Analysis #Graph #Market Share
-

Travel Agency Market Share and Trends – Data Slide for Competitive Advantage
#Market and Competitor Analysis #Diagram #Graph
-

Travel Destination Infographic Market Share – Intuitive Data Visualization
#Market and Competitor Analysis #Graph #Market Share
-

Palm Donut Chart – Market Share and Data Visualization
#Market and Competitor Analysis #Graph #Market Share
