Visualizing Market Share with Watercolor Donut Chart
RJ0600049_6
- Last Update 07/04/2025
- File Size 9MB
- # of Slides 2
- File Format PPTX
- Slide Ratio 16:9
- Color
Keywords
About the Product
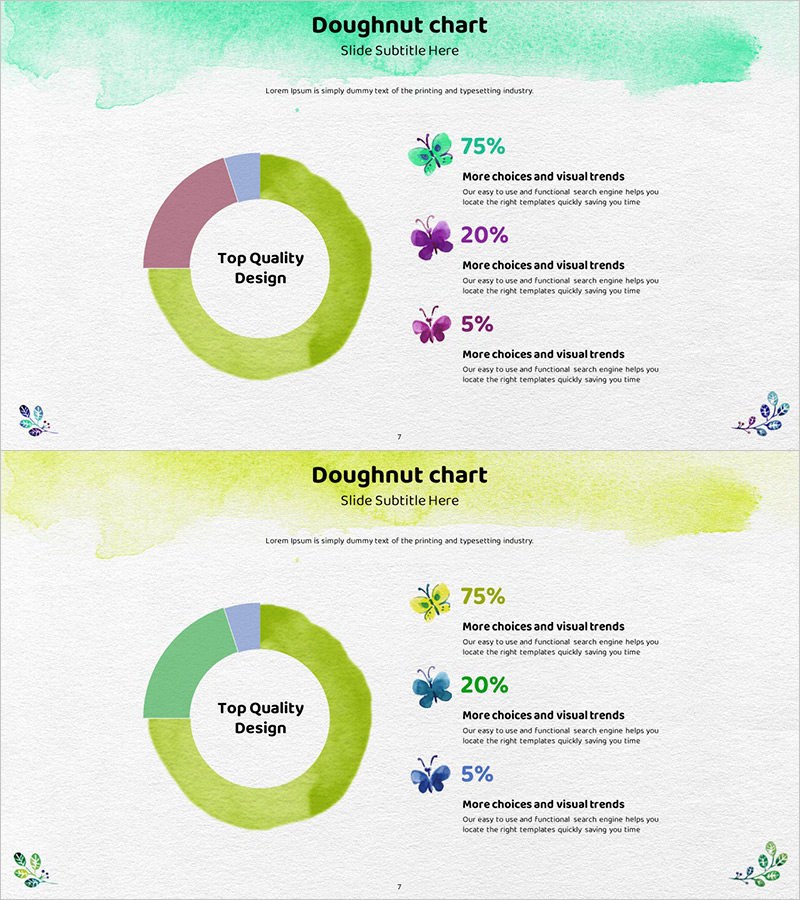
A donut chart PowerPoint slide featuring soft watercolor backgrounds and gradient-filled segments in lime, mauve, and purple tones. This presentation template visualizes market share, sales ratios, customer composition, and budget allocation with three data segments (75%, 20%, 5%) clearly labeled with percentages and descriptive text. Decorative butterfly icons add visual interest to the slide layout. The 2-slide set is fully editable in 16:9 widescreen format, allowing you to customize colors, values, and labels to match your specific data. Ideal for business reports, marketing presentations, and financial summaries requiring intuitive ratio visualization.
Usage Points
-
Main Usage
Effectively communicate proportional relationships such as market share, sales distribution, customer demographics, budget allocation, and product mix. The soft watercolor aesthetic combines data credibility with visual appeal, making it suitable for executive reports, marketing pitches, and stakeholder presentations where both accuracy and design impact matter.
-
How to Use
Edit the donut chart segments and percentage values directly in the slide master to reflect your actual data. The butterfly icons and text labels are independently movable and deletable, allowing layout customization. To add more segments, duplicate the chart shape and adjust colors and values accordingly. The 16:9 format maintains consistent left-chart, right-legend positioning across both slides.
-
Recommended For
Marketing professionals presenting market analysis and competitive positioning, sales teams reporting quarterly performance, finance departments explaining budget distribution, product managers analyzing portfolio composition, and executives delivering business performance summaries. The watercolor design also suits creative industries, brand presentations, and client pitches emphasizing visual storytelling alongside data.
-
Slide Structure
Each slide features a watercolor background (mint, lime, and yellow tones) with a centered donut chart displaying three colored segments (lime 75%, mauve 20%, purple 5%) and a right-aligned legend area. The legend uses color icons, percentage values, and descriptive text in a three-column layout. Decorative butterfly illustrations appear in the lower left and right corners. Both slides share identical structure, enabling consistent multi-dataset presentations.
Related Products
-

Travel Destination Infographic Market Share – Intuitive Data Visualization
#Market and Competitor Analysis #Graph #Market Share
-

Fashion Design Comparative Donut Chart – Market Share Analysis
#Market and Competitor Analysis #Graph #Market Share
-

Palm Donut Chart – Market Share and Data Visualization
#Market and Competitor Analysis #Graph #Market Share
-

Donut Chart Slide for Furniture Preferences Survey
#Market and Competitor Analysis #Graph #Market Share
