Curve Graph on a Pegboard – Market and Competitive Analysis
RJ0900016_27
- Last Update 08/20/2025
- File Size 0.1MB
- # of Slides 2
- File Format PPTX
- Slide Ratio 16:9
- Color
Keywords
About the Product
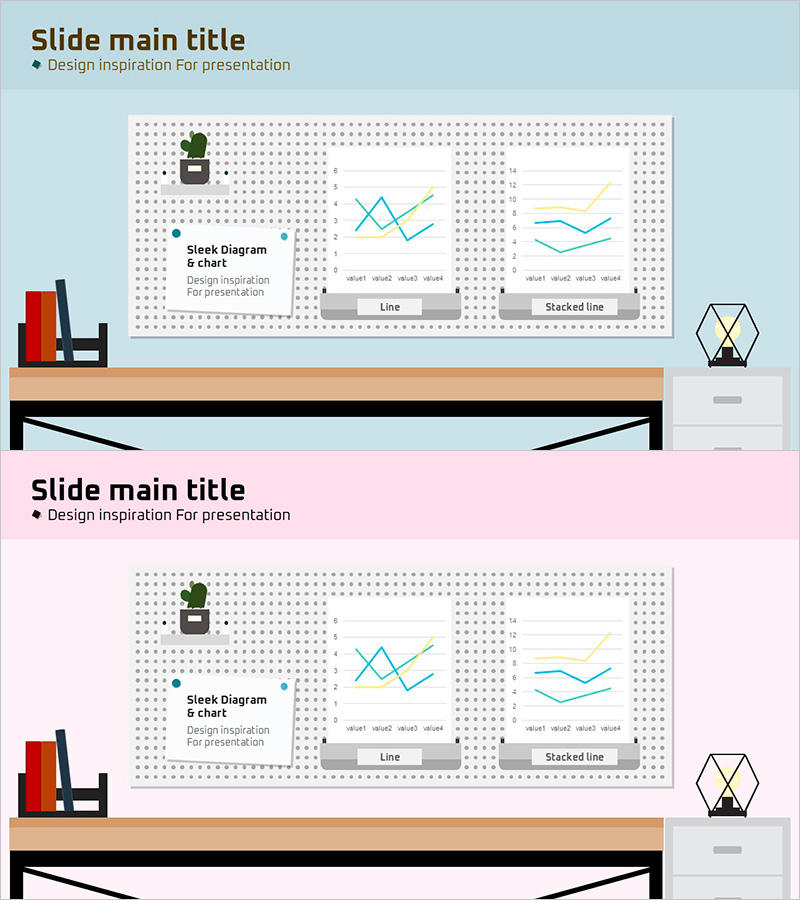
A 2-slide line chart PowerPoint template designed for market analysis and competitive positioning. Features a minimalist pegboard-style background with two distinct data visualization formats: a standard line chart and a stacked line chart. Each slide accommodates four data points, making it ideal for time-series comparisons and competitive benchmarking. Delivered in 16:9 widescreen PPTX format, fully editable and ready for immediate use in presentations and business reports.
Usage Points
-
Main Usage
Visualize time-series data such as market trends, competitor performance, and revenue growth. Line charts communicate trend changes intuitively, while stacked line charts simultaneously show component contributions, strengthening decision-making support in business presentations.
-
How to Use
Insert into business plans, investor pitch decks, and quarterly performance reports in the market analysis section. Edit line colors and data values to reflect actual figures, then adjust legends and axis labels to match your presentation context and audience needs.
-
Recommended For
Marketing managers, executives, financial analysts, and consultants presenting market dynamics and competitive positioning. Particularly effective for quarterly and annual performance comparisons, competitor benchmarking, and market share evolution narratives.
-
Slide Structure
Two-slide set with first slide featuring a standard line chart (2 lines, 4 data points) and second slide showing a stacked line chart (2 lines, 4 data points). Both slides include title input areas, legends, and axis labels for complete data visualization and professional presentation.
Related Products
-

3D Area Graph – Market Analysis and Competitive Advantage
#Market and Competitor Analysis #Graph #Market Analysis
-

Audio Icons and Comparison Graphs – A New Dimension in Market Analysis
#Market and Competitor Analysis #Graph #Market Analysis
-

Market Competition and Analysis Graphs – Enhance Business Advantage
#Market and Competitor Analysis #Graph #Other
-

Office Interior Analysis Graph - Visualizing Competitive Advantage
#Market and Competitor Analysis #Graph #Market Analysis
