Tweezers and Table Charts – Stylish Diagram Design
RJ0900016_20
- Last Update 08/20/2025
- File Size 0.1MB
- # of Slides 2
- File Format PPTX
- Slide Ratio 16:9
- Color
Keywords
About the Product
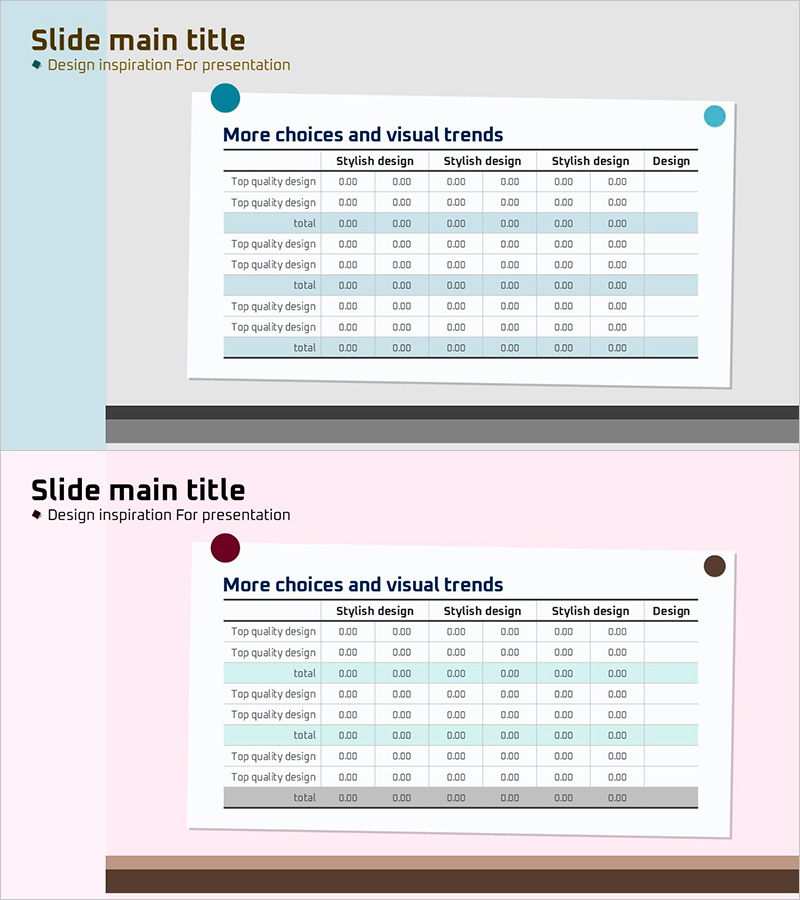
A PowerPoint slide combining a tweezers-shaped selection element with a 6-column table chart for data visualization. The light blue background with dark text and lines creates clear information hierarchy in your presentation. This 2-slide set is ready to use immediately for various data comparison scenarios. The tweezers icon visually conveys selection and emphasis, while the table format allows simultaneous comparison of multiple items and metrics.
Usage Points
-
Main Usage
Use this slide when comparing numerical data across multiple items and highlighting specific entries. The tweezers icon visually represents selection and focus, while the table format organizes information systematically. Applicable to marketing performance analysis, product specifications, competitive comparison, and various business contexts.
-
How to Use
Enter data or text into the table cells shown on the slide and adjust the tweezers position to indicate the item you want to emphasize. Background colors and line styles can be customized to match your corporate brand. The 16:9 widescreen format is optimized for modern projectors and displays.
-
Recommended For
Ideal for marketing teams presenting performance metrics, product planning teams comparing specifications, sales teams making client proposals, executive reports, and academic presentations. Suitable for any presentation requiring clear quantitative data communication.
-
Slide Structure
Slide 1: Tweezers icon + 6-column table chart (7 rows including header). Slide 2: Alternative layout with identical structure. Light blue background, dark borders and text, tweezers graphic for selection emphasis.
Related Products
-

Abstract Pattern Template for Business Vision – Effective Cluster Structure
#Business Vision and Strategy #Diagram #Business Vision
-

Business Forest Wide Template Diagram2 – Flowchart for Market Strategy
#Marketing Plan and Strategy #Diagram #Target Market Strategy
-

BUSINESS PLAN Presentation Template STEP DIAGRAM – Business Implementation Strategy
#Business Strategy #Operational Plan #Diagram
-

Abstract Pattern Presentation History – Stylish Flow Visualization
#Company Introduction #Diagram #History
