Abstract Pattern Diagram 1 – Visualizing Service Development Plans
RJ0200033_7
- Last Update 04/07/2025
- File Size 0.3MB
- # of Slides 2
- File Format PPTX
- Slide Ratio 16:9
- Color
Keywords
- #Content-Based Slides
- #Design-Based Slides
- #Technical Approach
- #Diagram
- #Service Development Plan
- #Service Implementation Plan
- #Cluster
- #Chain Diagram
- #16:9
- #gear diagram PowerPoint
- #connection diagram slide template
- #service development process visualization
- #3-node diagram PowerPoint
- #process flow presentation slide
About the Product
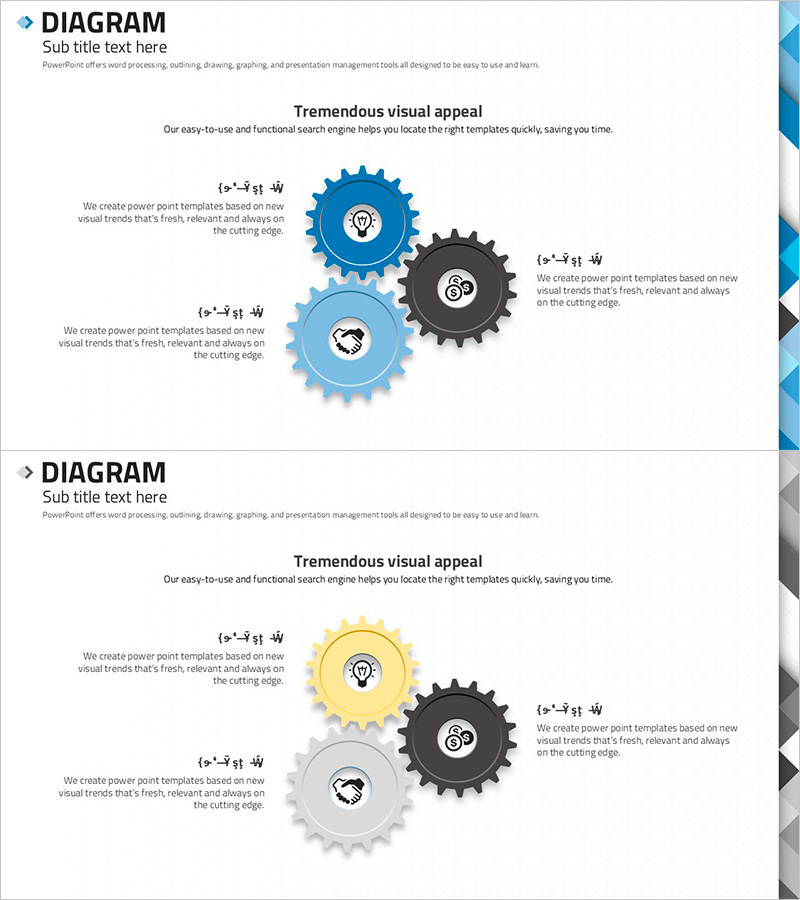
A gear connection diagram PowerPoint slide that visualizes service development plans and processes. Three gear nodes in navy, charcoal, and light blue tones are interconnected to represent workflow and mutual interaction. Each gear contains an icon symbolizing core service development elements such as ideation, execution, and operation. The 2-slide set offers multiple color combinations for immediate use in presentations, business plans, and strategy reports. Ample text areas allow flexible addition of descriptions and explanations.
Usage Points
-
Main Usage
Express service development plans, processes, and relational structures through gear connection architecture, making complex concepts intuitive and accessible. Effectively emphasizes cyclical relationships among three core elements such as ideation, execution, and operation.
-
How to Use
Insert into process explanation sections of presentations, business plans, and strategy reports to enhance audience comprehension. Edit text in each gear node to adapt to various contexts including organizational structure, interdepartmental collaboration, and project phases.
-
Recommended For
Ideal for service planners, development team leads, business managers, and consultants presenting at strategy meetings, investor pitches, and internal reports. Particularly valuable in IT, startup, and manufacturing industries where process-centric communication is essential.
-
Slide Structure
2-slide set featuring three gear nodes in navy, charcoal, and light blue arranged in triangular formation with interconnecting lines. Each node includes icon placement area and text input field, with arrows indicating relationships between nodes.
Related Products
-

Deer and Circular Diagram – Vision for Business Execution
#Business Strategy #Technical Approach #Diagram
-

Colored Pencil Connected Diagram – Service Operations and Execution
#Technical Approach #Diagram #Service Operation Plan
-

Circular Connection Diagram – Operations Plan and Service Execution
#Operational Plan #Technical Approach #Diagram
-

Round Circular Block Diagram – Analysis of Technical Sector Service Operations
#Technical Approach #Diagram #Service Operation Plan
