Illustration Glass Bottle Graph for Market Analysis – Competitive Edge
RJ0900016_15
- Last Update 08/20/2025
- File Size 0.1MB
- # of Slides 2
- File Format PPTX
- Slide Ratio 16:9
- Color
Keywords
About the Product
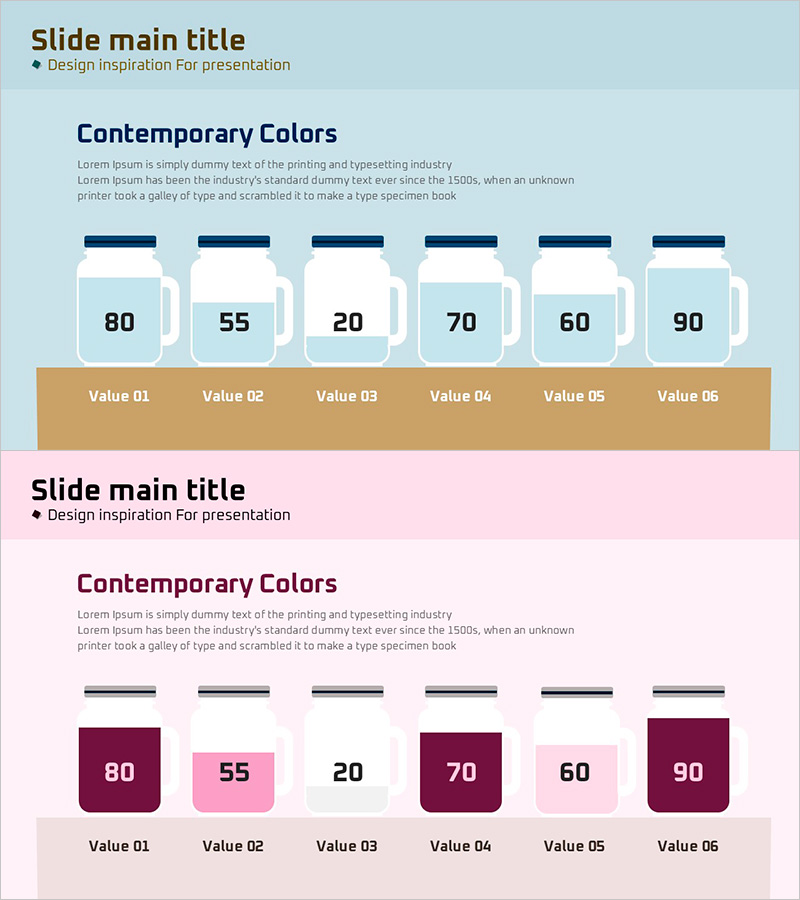
A PowerPoint slide featuring an illustrated glass bottle graph for market analysis and competitive advantage visualization. The light blue background displays six data values in bottle-shaped charts, allowing you to input numerical data (80, 55, 20, 70, 60, 90) in the upper bottle section and item labels in the lower tan-colored bar. This intuitive data visualization structure is ready to use in marketing presentations and business analysis decks. The 16:9 widescreen format with 2-slide composition supports various market data comparisons, and all colors and values are fully editable in PowerPoint for brand customization.
Usage Points
-
Main Usage
Compare six data points such as market analysis, competitor benchmarking, and product performance metrics at a glance to support decision-making. The friendly glass bottle illustration softens hard data presentation, making it effective for marketing, business analysis, and investment pitch decks when emphasizing competitive advantages.
-
How to Use
Input comparison values into each bottle-shaped chart and enter item names (Value 01–06) in the lower label bar. Customize the light blue background and tan label bar colors to match your corporate brand. Use PowerPoint shape editing to adjust the number of bottles as needed. Insert into market overview, SWOT analysis, or competitive comparison sections to increase presentation impact.
-
Recommended For
Ideal for marketing strategy documents, business analysis reports, investment pitch decks, and executive briefing presentations requiring market data and competitive metric comparisons. Particularly suited for quantitative value comparisons in market analysis, product performance evaluation, and customer satisfaction survey result presentations.
-
Slide Structure
Two-slide composition: Slide 1 features a light blue background with 6 bottle-shaped charts and a tan label bar; Slide 2 uses a pink background with 6 bottle-shaped charts (some with color emphasis) and a beige label bar. Each slide includes a title area, descriptive text section, 6 numerical input fields, and 6 item name input fields.
Related Products
-

Travel Guide Market Analysis by State in the United States Using Horizontal Bar Chart
#Market and Competitor Analysis #Graph #Other
-

Abstract Pattern Area Chart Template – Distinctive Data Visualization
#Market and Competitor Analysis #Graph #Other
-

Analysis Graph of Young and Old Age Groups – Market and Competitive Insights
#Market and Competitor Analysis #Graph #Other
-

Bundled Graphs and Maps for Business Plan Visualization
#Market and Competitor Analysis #Graph #Other
